

How do you know if your ecommerce store is working the way you want it to? Are you relying on intuition to guide you, or are you relying on something more advanced? The good news is that you can track your website’s performance in a scientific and measurable way using KPIs or Key Performance Indicators.
Once you have created your online store, think of KPIs as rowers leading your boat to success. Your business goals are the end goal, but if your rowers aren’t in sync, you won’t get there. Your KPIs should be front and center of your business because they are a good indicator of how healthy your business is and how likely you are to achieve your goals.
You also don’t need to be a math whiz or a data scientist to perform these calculations – we’ll walk you through them step-by-step.
What are e-commerce KPIs?
Key performance indicators are metrics used to measure the success of day-to-day business activities against your e-commerce goals. Think of these numbers as a measure of whether you’re moving toward a bigger goal. For example, your goal might be to increase sales by 25% by the end of the year. Your KPIs are activities that can help you achieve that goal, such as “Increase the number of unique visitors by 15%” or “Increase the average shopping cart size by 10%.”
Top Ecommerce KPIs
So, which KPIs should you track for your business? There are no hard and fast rules, but experts recommend you focus on about five top metrics based on your unique business profile. You may want to recoup the money invested in your business, increase your profit margins to focus on your side business full time or expand into new product lines or areas. Your KPIs should be based on where you are going and reflect how you will get there.
Let’s look at the three main KPIs your ecommerce business should track:
Average order value
Average order value, or AOV, measures how much a customer spends in your store each time they place an order. You can calculate this by dividing total sales by the number of transactions, as follows:
Total Sales / Transactions = Average Order Value
This helps you better understand your customers and promote your special offers and Marketing activities. For example, if your average order value is $50, you can increase your order size by offering free shipping on all orders over $75.
customer lifetimemy worth
Customer Lifetime Value (CLV) measures how much revenue your ecommerce store can earn from the average customer throughout the relationship. Loyal customers are more likely to make repeat purchases and referrals, and spend more over time, than customers who only make a lot of one-time purchases.
For example, Customer A spends $1,000 on a big-ticket item on your site, but never comes back. Client B spends an average of $15 per visit when visiting twice a month. You might think you should focus on convincing Customer A to return to your website, but you should actually spend your marketing budget to retain Customer B.
The CLV calculation shows:
Average Deal Size x Yearly Deals x Retention Period = Customer Lifetime Value
$15 (average deal size) x 24 (annual visits) x 5 years (active years) = $1800
Try to increase customer lifetime value by Loyalty Program and special offers. Retention is often more economically valuable (and less costly) than pursuing new customers.
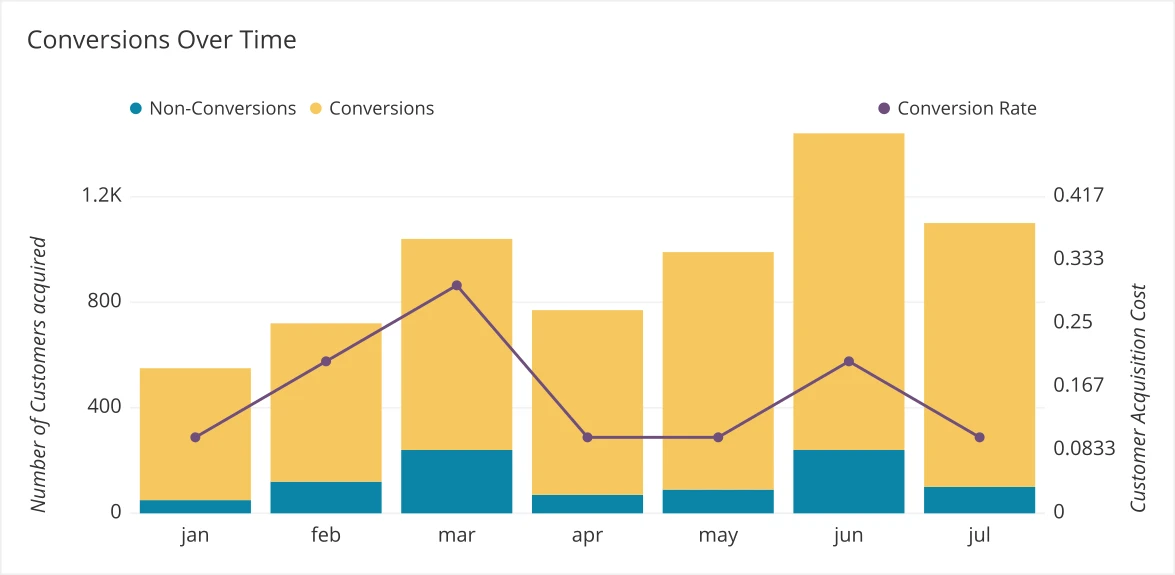
sales conversion rate
Your sales conversion rate shows how successful your ecommerce store is in converting visitors into actual paying customers. Of course, that in itself reveals a lot!
Your sales conversion rate shows that your SEO and advertising campaigns are targeting the right customers, that your customers are finding what they are looking for, and that your user experience is driving customers to buy…or not. Your sales conversion rate is calculated as follows:
Sales / Visits = Sales Conversion Rate %
If the number is really low, don’t worry – average conversion rate The share of US e-commerce stores is about 2.86%. Always research your ecommerce benchmarks to ensure your goals are realistic and in line with industry averages.
Best KPIs to Measure Ecommerce Business Performance
Now that we’ve looked at the three most commonly used KPIs in ecommerce businesses, we can take a look at some other KPIs you might want to consider. As we mentioned, the best KPIs to measure your ecommerce business performance can vary from company to company depending on your goals, so consider each option based on your own website.
your total sales
Your overall sales data is one of the most important E-commerce KPIs and metrics to track. Unlike some of the other metrics we’ve looked at, no manual calculations are required here. Your ecommerce platform or plugin should have sales and revenue tracking features accessible through its dashboard. We recommend adding Google Analytics to your website to access richer data.
If you are already using basic page tracking, simply add JavaScript to your website and shopping cart software to send transaction and product data to Google Analytics. Once your website is set up, you can easily track your ecommerce results. Try checking your overall sales on a daily, weekly, monthly, quarterly and yearly basis. You may be able to spot important seasonal trends and data that you can use in the future to increase your overall sales figures.
monthly traffic growth rate
Anyone with a website needs to track traffic growth – the more traffic you have, the more leads you can get. This KPI also indicates how well your paid advertising and SEO are performing.
You can easily track your monthly growth rate using the following formula:
(Sessions in the current month – Sessions in the previous month) / Sessions in the previous month x 100 = % monthly growth rate
You can also use this formula to calculate your annual traffic, just use annual data instead of monthly data.
time spent on site
Time spent on your website is the average amount of time a visitor spends browsing your website and scrolling through your content before leaving. This metric is important because it shows how relevant your website is to the visitors you are targeting. If a customer lands on your website and clicks away right away, chances are they’re not the customer you want to spend your marketing dollars on. You can find the time spent on-site in Google Analytics (called the Average Session Duration metric) or calculate it manually:
Time spent by users on the site / (page views – page exits) = average time spent on the site
According to the data, the average time spent on the website is less than a minute (54 seconds) center point, but for a highly engaged site like Amazon, a session can last up to ten minutes. The best way to increase time spent on your site is to optimize your site speed and layout – slow, cluttered pages can lead to high bounce rates.Helpful Tip: Here are a few methods you might want to check out Optimize your user experience If the average time you spend on the site is below your industry benchmark.
ROAS
Are your ads delivering the results you want? You can measure the effectiveness of your marketing efforts by calculating how much you earn for every dollar you spend on advertising:
Campaign Revenue / Campaign Cost = ROAS
Again, what is considered “good” ROAS varies from business to business, but in general you should aim for a ROAS of about 3:1, meaning you earn 3 per dollar spent dollars in revenue. The higher your ROAS, the more effective your ads will be at reaching high-income customers. A lower ratio usually indicates that you need to adjust your ad or spend less.
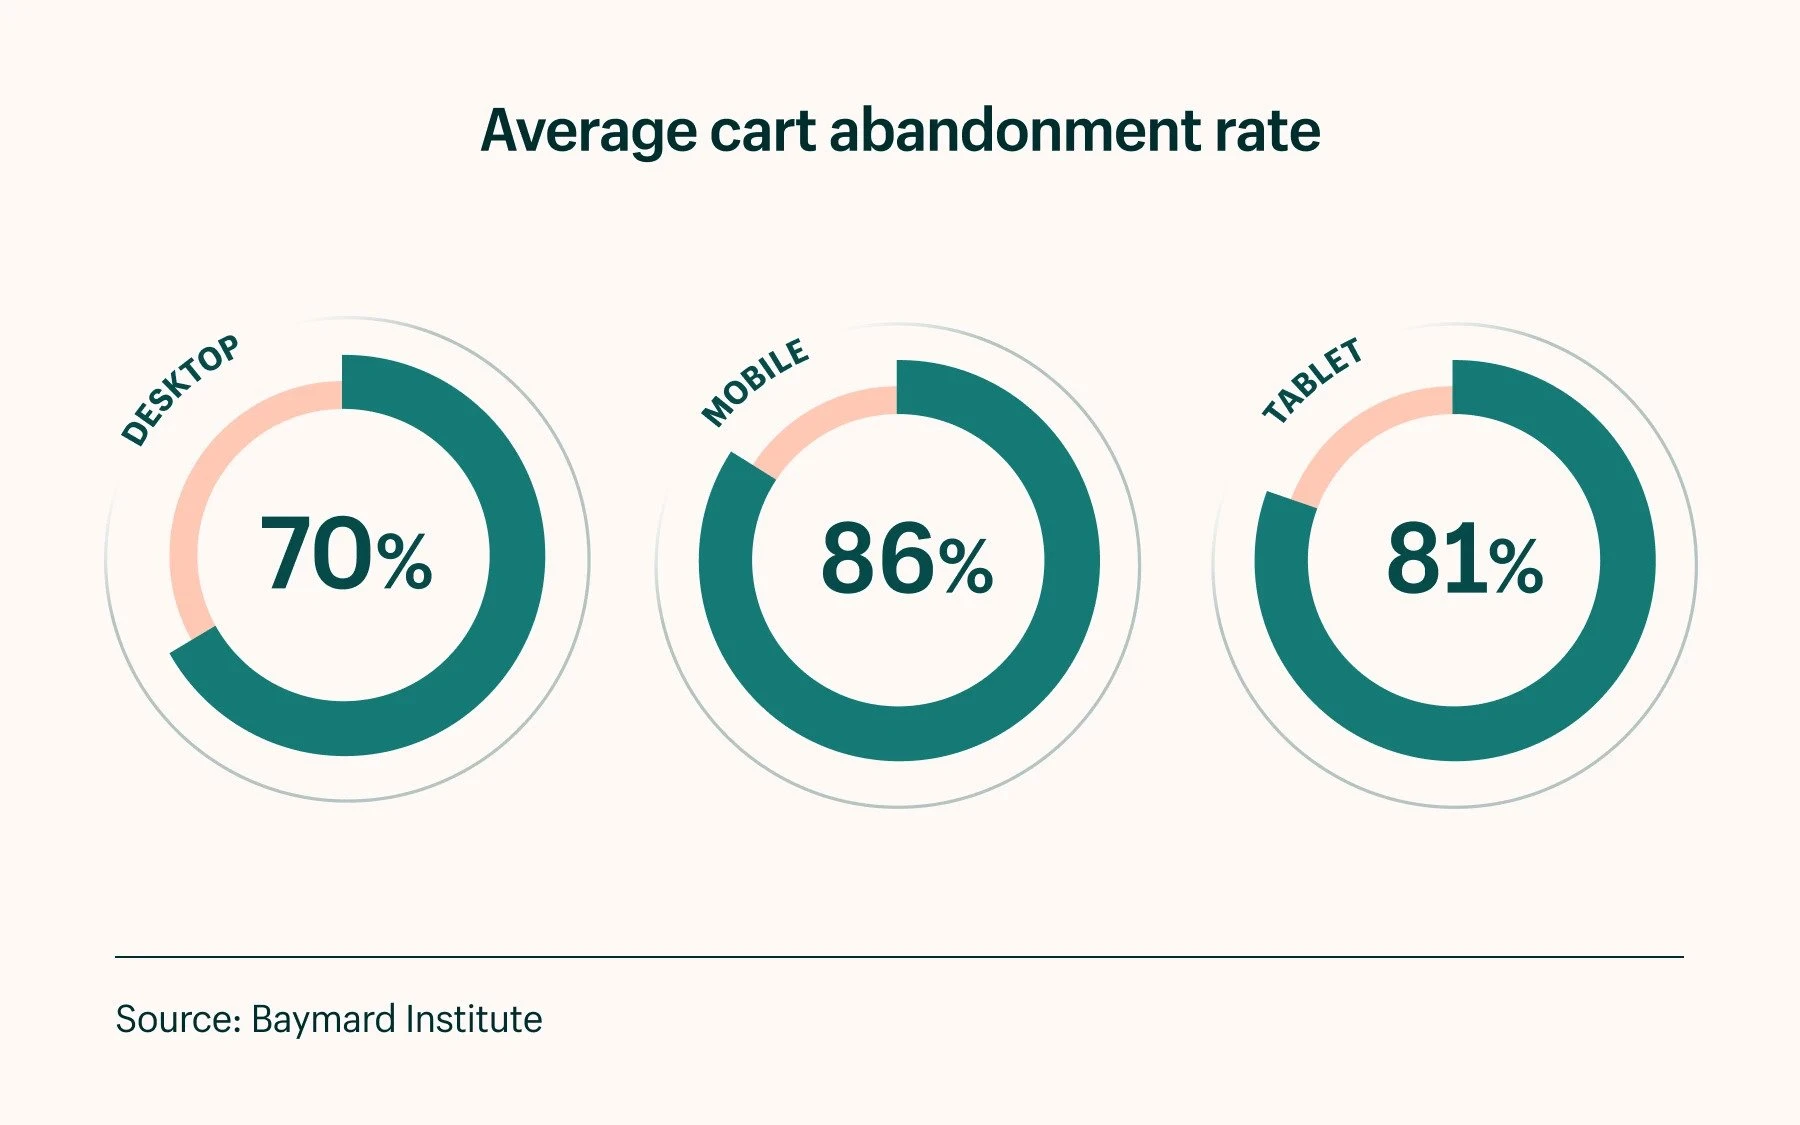
Cart abandonment rate
Cart abandonment occurs when a visitor adds an item to their basket or cart and leaves without completing the purchase. Cart abandonment rates are usually high.
(77.13%, depends on your industry), but you should try to minimize this.
Most cart abandonment rates are calculated automatically by your ecommerce tools, but you can also calculate abandonment rates manually:
(Purchase Completed / Cart Created) x 100 = Cart Abandonment Rate
Abandoned shopping carts are a reality for all ecommerce sites, but try to investigate and address why. A complicated checkout process or lack of payment options can lead to abandonment, while the ability to add an item to a wish list and send a push notification to remind shoppers that they have items for sale in their carts can save sales.
customer acquisition cost
You’ve invested money in one (or two) ad campaign and customers keep pouring in. It’s a good thing, right? Actually, as your Customer Acquisition Cost (CAC) might show, it depends. First, you need to know how much it will cost to get these customers through your digital doors.
You can do this with a very simple customer acquisition cost calculation:
Activity cost / number of new customers = customer acquisition cost
Let’s say you spend $5,000 on an Adwords campaign targeting new users. As a direct result of the campaign, you received 200 customers. Your CAC is $25. This information is useful when you are planning a new campaign. If you want to attract 1,000 new customers to your website by the end of next quarter, you’ll need to spend at least $25,000 to do so.
You can also compare the costs of different campaign channels. For example, if your cost per acquisition is $25 for Google Ads and $15 for Facebook Ads, then you know you should spend more on Facebook to lower your advertising and acquisition costs.
customer satisfactionconversion rate
If your KPIs don’t look as healthy as you’d like, and you’re not sure why you’re checking your customer satisfaction. You can determine customer satisfaction by sending a survey after a customer purchases or receiving an item and asking your shoppers to rate their experience on a scale of 1 to 5, with 5 being the most satisfied.
You can calculate your customer satisfaction by adding up all the customers who rated you four or five and dividing by the number of respondents.
(4 and 5 points/total number of respondents) x 100 = Customer Satisfaction Score
The average customer satisfaction you can expect is around 73.3%. If your scores are consistently below average, it’s worth following up with your customers to see how you can improve their experience in the future.
wrap up
KPIs are not just numbers. They provide real insight into the performance of your e-commerce business. Measuring and following your KPIs will help you achieve your business goals faster and steer your business in the right direction. They can reveal problems and areas for improvement, and help you make critical business decisions based on data rather than pure intuition.

