


As we receive more news every day, it is useful to understand how financial and other indicators view the economic outlook.
figure 1: The five-year inflation break-even point (blue) and the 10-year to 3-month period spread (red) are both expressed in %. Source: Federal Reserve Board and author’s calculations.
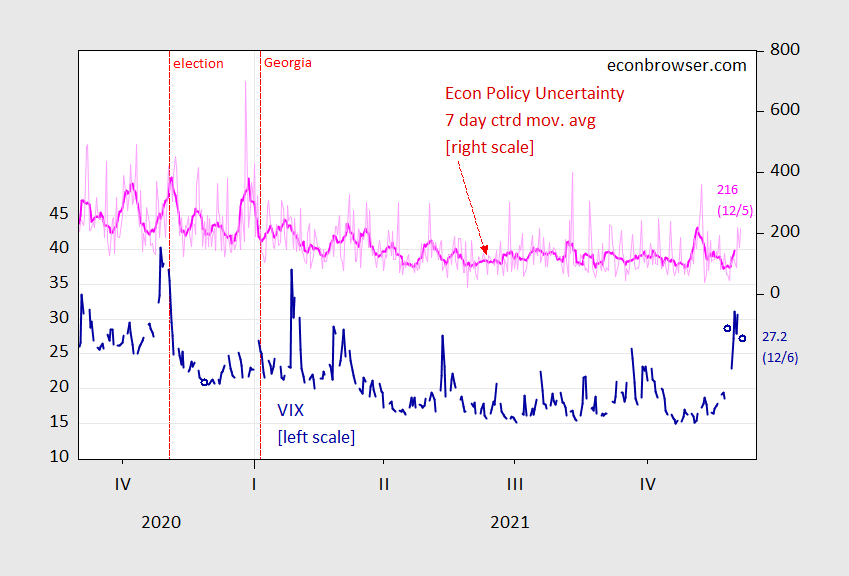
figure 2: VIX (blue, left scale) and economic policy uncertainty index (light pink line, right scale), and EPU 7-day centered moving average (thick pink, right scale). Source: CBOE calculated by FRED, policyuncertainty.com and the author.
The break-even point and term spread did not change much over the weekend. Interestingly, the financial market risk indicator (VIX) shows greater volatility than the news-based policy uncertainty indicator (from Baker, Bloom, and Davis).


