

How did the Fed get it wrong?
Monetary stimulus may lead to lower unemployment (which voters usually want), but higher inflation (which voters usually don’t want). One view of this trade-off is that monetary policy should strive to keep aggregate output around its long-term potential value. According to this view, as long as GDP is below potential, more stimulus may help reduce unemployment with little inflation cost. But if GDP is above potential, more stimulus will have little effect on unemployment and will mostly lead to higher inflation.
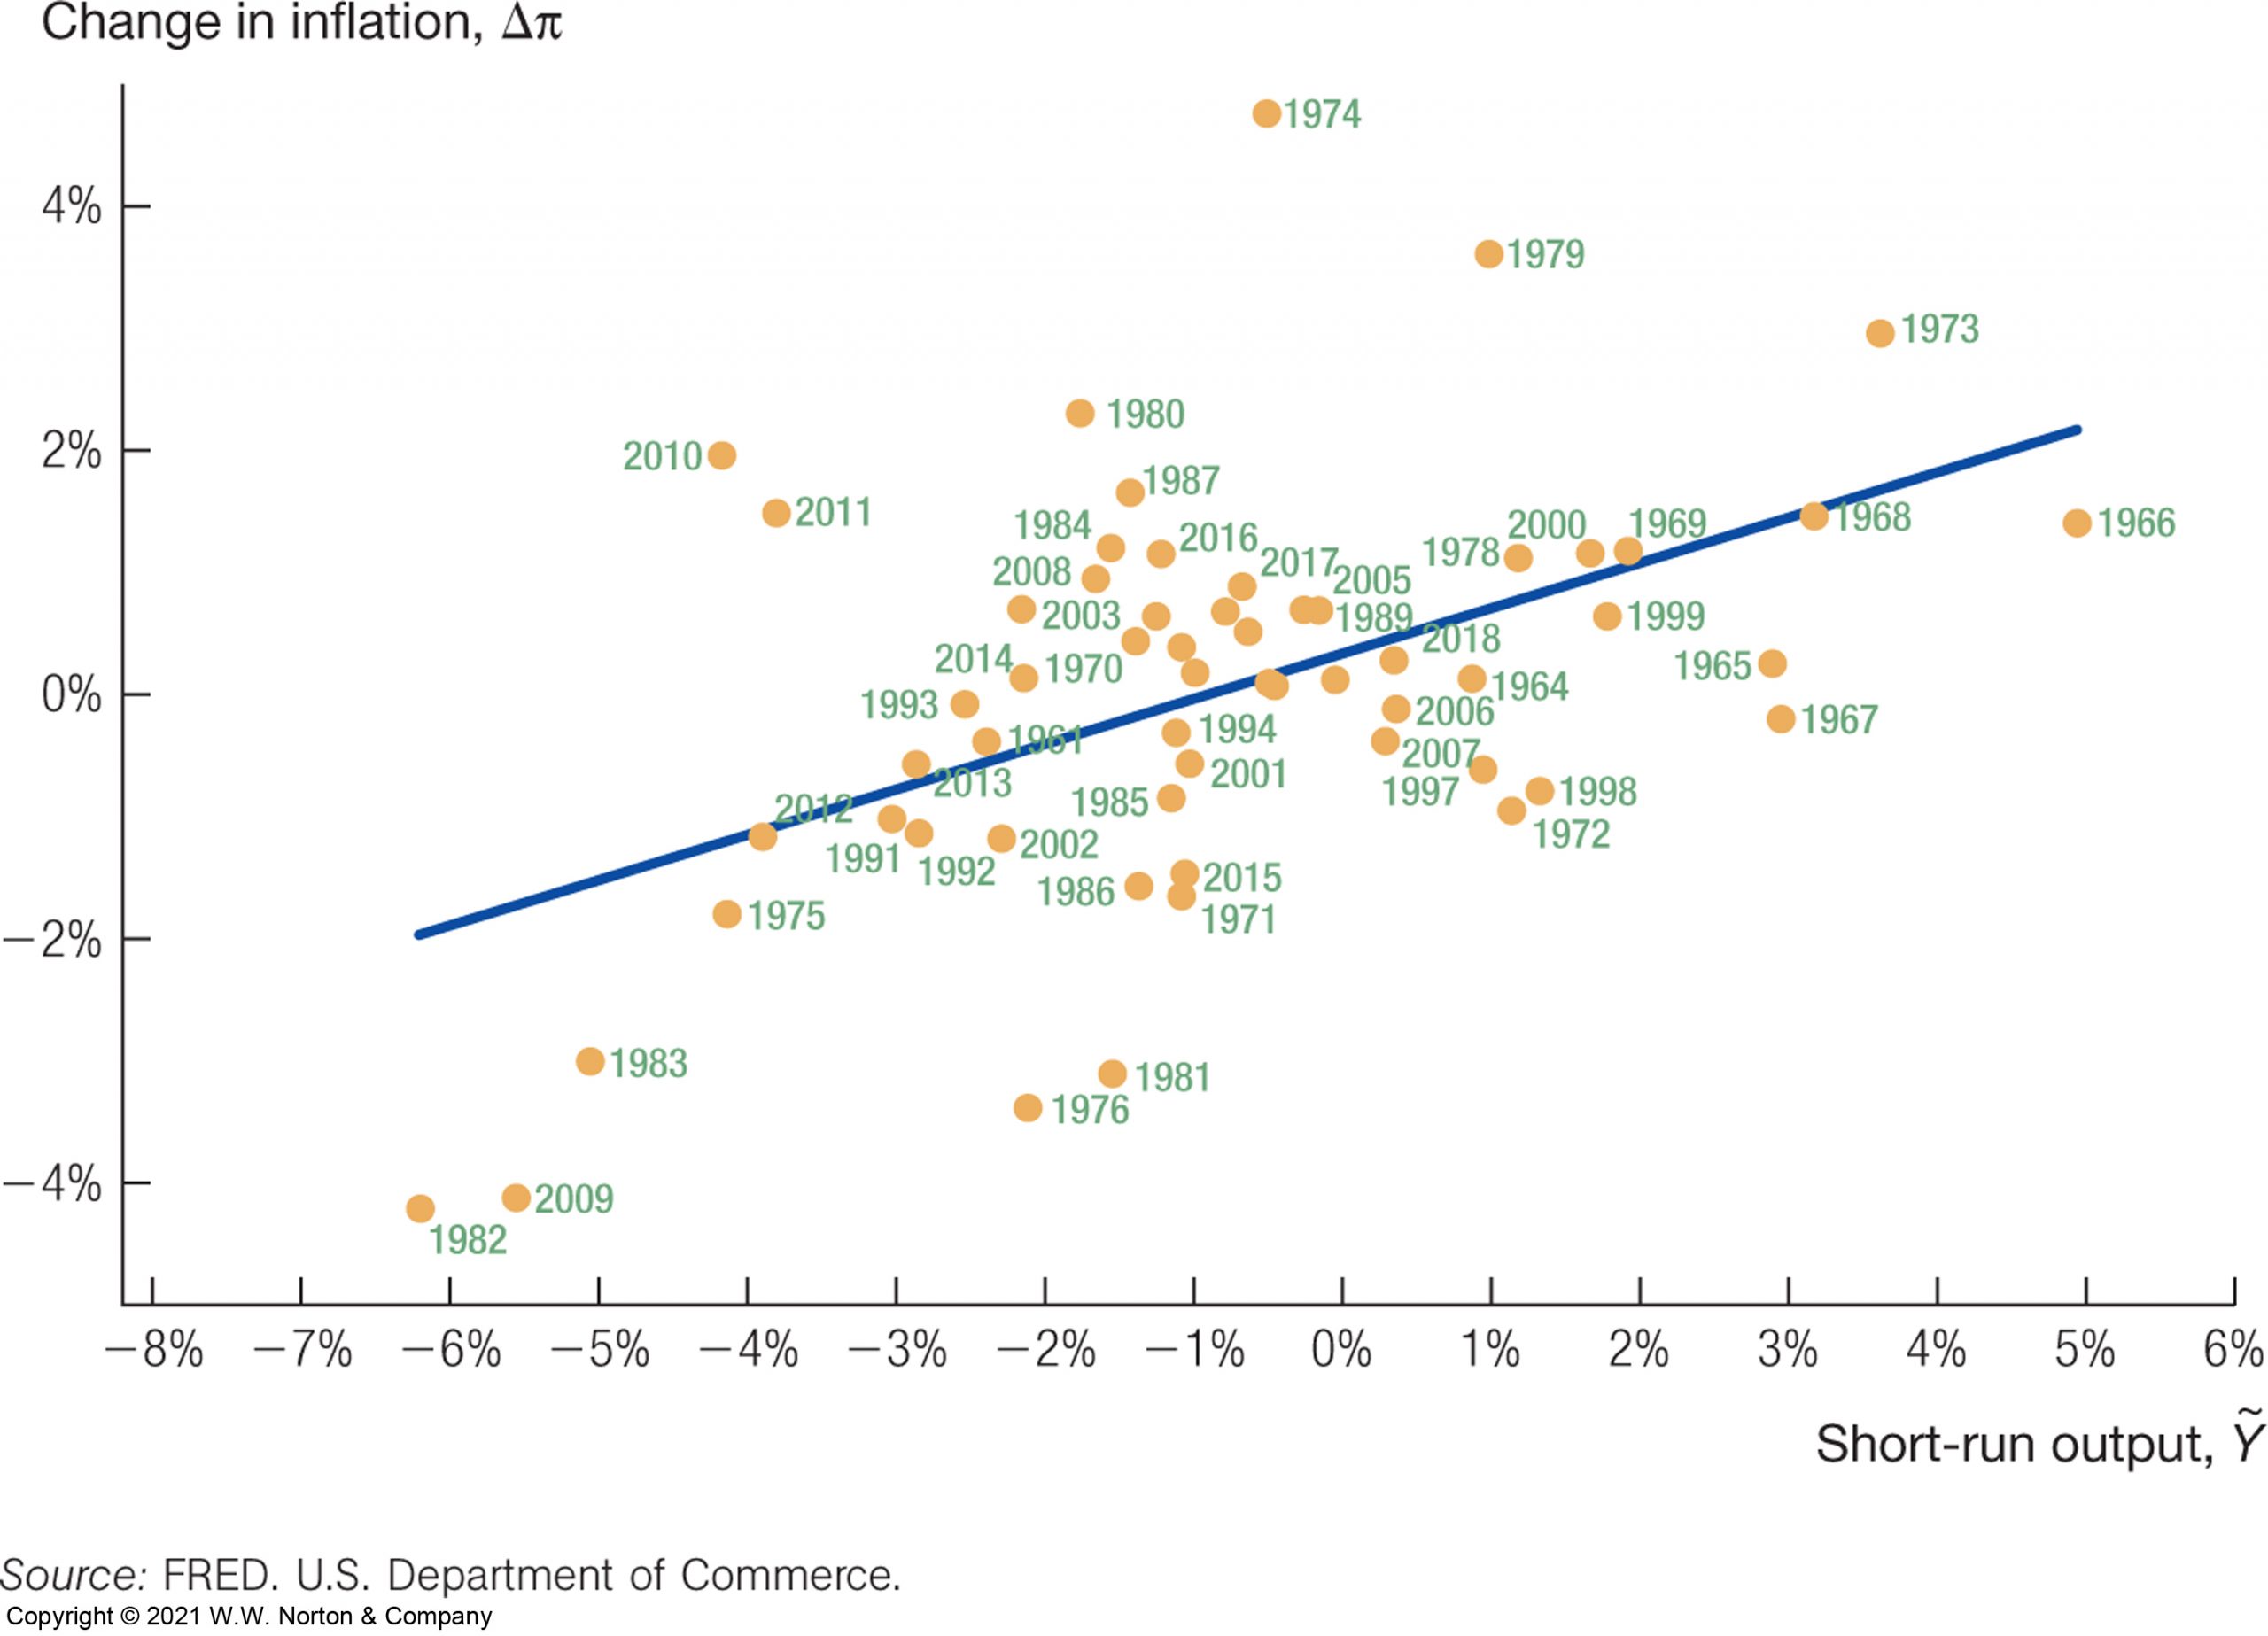
Below image, taken from Leading undergraduate macroeconomics textbook, summarizes some of the empirical evidence sometimes used to support this view. Each year between 1964 and 2018 is represented by a circle. The horizontal axis summarizes whether the current year’s real GDP was above or below the CBO’s estimate of potential GDP, and by how much. The vertical axis summarizes whether the current year’s inflation rate was higher or lower than the previous year, and by how much. Years in which inflation is unchanged from the previous year (zero on the vertical axis) tend to be years where output equals potential (zero on the horizontal axis). Years when inflation rises sharply are usually years when output is well above potential.
Source: Charles I Jones, macroeconomicsFifth Edition, Figure 9.7, WW Norton & Co., Inc., 2021.
The figure below plots this data in another way. The graph above plots the gap between real GDP and potential GDP for each quarter from the first quarter of 1960 to the first quarter of 2022. From the most recent data, the gap remains negative. Policymakers, guided by previous data and the CBO’s latest estimates of potential GDP, would conclude that we can continue economic stimulus in 2021 and 2022 without fear of rising inflation.
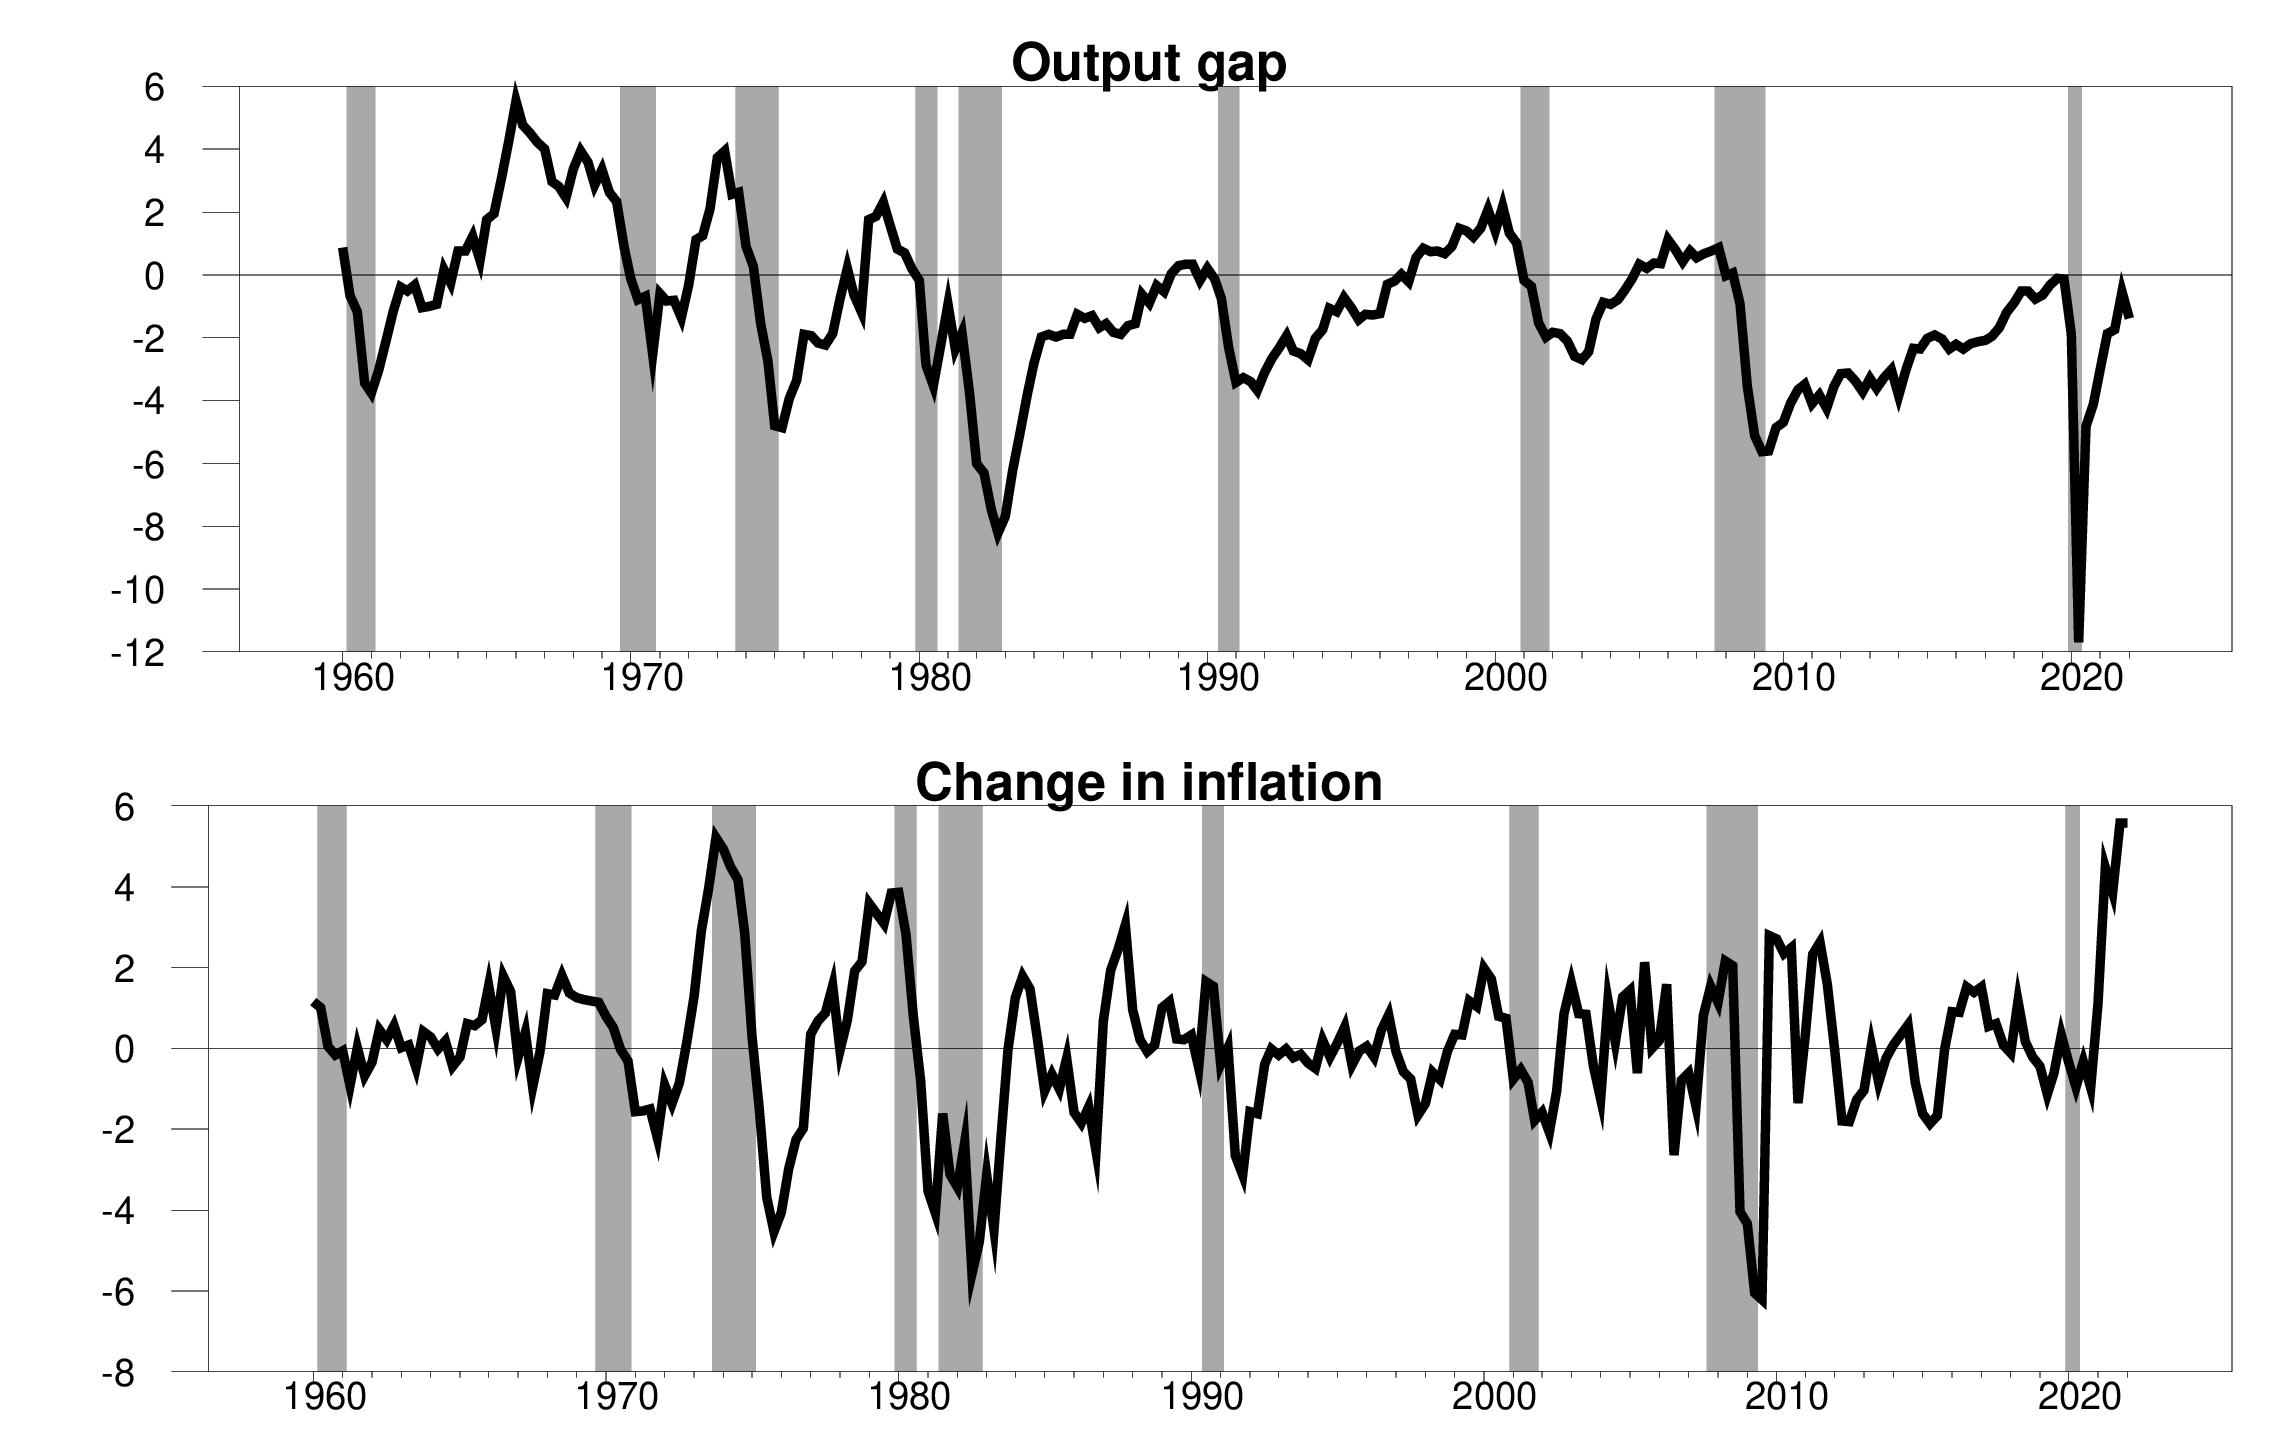
Above: logarithmic difference between 100x real GDP and potential gross domestic product, 1960:Q1-2022:Q1.Below: Quarterly Inflation Rate Changes YoY Ton (measured by Consumer Price Index) and quarterly year-on-year inflation Ton-4.
oops! The bottom panel shows that this is not the result, because now everyone is very clear. Inflation has been rising. When Professor Jones updates his textbook, the first numbers will show some very impressive outliers for 2021 and 2022.
But if history is any judgement, these may not be as impressive outliers as one might guess from the plotted data. I say this because my guess is that, given what we know about inflation now, in retrospect, the CBO will decide that it probably overestimated potential GDP in 2021 and 2022. If the CBO later decides that potential GDP in 2021 is lower than what they currently report, that would make the output gap in 2021 positive rather than negative, and make the data appear to predict an increase in inflation at least in 2021 and 2022 . One of the reasons the first plot seems to fit the data as well as it does (and honestly, the fit is not that good) is because the variables on the horizontal axis are adjusted after the fact to better correspond to what happens on the vertical axis on the variable.
My point is that this conventional understanding of stimulus limitation is not the right way to think about what has happened over the past two years, and in fact it never was.i argue recent papers The key feature that makes a modern economy productive is the specialization of labor, capital, and production networks. These are designed to do very specific tasks very efficiently. In such a world, how much the economy is able to produce depends not only on the size and quality of our labor and factories, but also on the match between the goods and services that producers pre-set they can provide and the specific needs for these items for potential buyers. . If the demand for a particular good falls relative to the resources that have been put into producing that good up front, the result will be a drop in the production of that good. Since we cannot change our majors instantaneously, the result is idle resources and a drop in total GDP.
Our current problems must be understood at the micro level of the imbalance between production capacity and specific demand, not the traditional summary of the amount of water sloshing around in the big tub of the macro economy. We are not producing more oil because specialized rigs are not on site. The car was not produced because the chip was not available. Airline flights were cancelled because the pilots who quit had not returned. Infant formula shortages are not something the Fed can fix.
I think most of us agree that this microscopic imbalance is a key component of the current situation.but I claim paper Most historic recessions involve the same problem, if people don’t want to buy the kind of cars Detroit is ready to produce, or construction workers sit idle because no one wants to buy a new home. The latter is certainly something the Fed can address. But I still think the construction market is best viewed in terms of the mismatch between the specialized factors of production and the demand for the specific product they are to produce (ie new homes).
Where are we now?Well, for example, to get more baby formula on the shelf, we can Relaxation of import restrictions and minimize Regulatory closure of production plants. But if the goal is to increase this particular component of GDP, then monetary and fiscal stimulus are the wrong drivers.

