

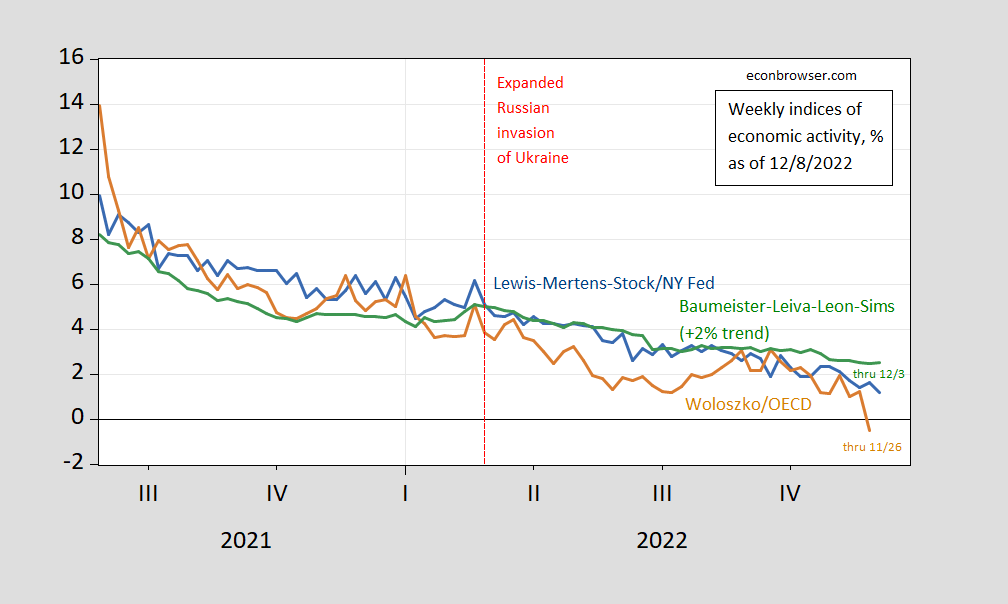
Lewis-Mertens-Stock (NY Fed) weekly economic indicators and Baumeister, Leiva-Leon and Sims WECI weekly indicators until 12/3; and Woloszko (OECD) Weekly Tracker as of 26 November.
figure 1: Lewis-Mertens-Stock (NY Fed) Weekly Economic Index (blue), Woloszko (OECD) Weekly Tracker (tan), Baumeister-Leiva-Leon-Sims U.S. Weekly Economic Conditions Index plus 2% Trend (green).Source: New York Fed via fred, OECD, WECIall accessed 12/8, and the author’s calculations.
The deceleration over time and various metrics has been pretty consistent. The OECD Weekly Tracker shows a significant drop and is only available until 11/26. In my experience, this collection – based on a big data approach – shows great variation over time. Helpfully, they provide a 95% high/low figure. In Figure 2, I’ve graphed the most recent year, as well as a selection of previous years.

figure 2: Woloszko (OECD) Weekly Tracker to 11/26 (tan), high/low (light tan), to 11/12 (green), to 10/15 (pink), to 8/20 (dark blue), Full year – year-on-year, %. resource: OECDVarious releases.
Given this data, I’d like to wait before announcing negative y/y growth. What is clear, however, is that U.S. economic growth is slowing year-on-year.

