

Core data beat consensus (5.4% y/y vs. Bloomberg 4.9%).
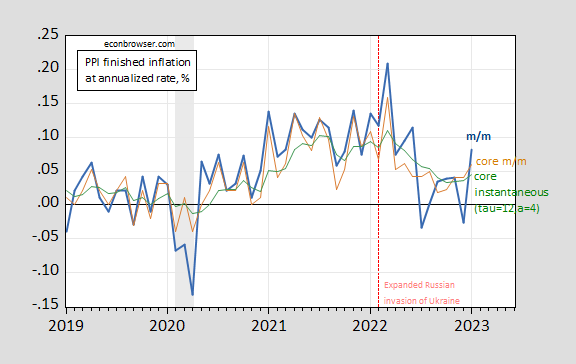
figure 1: MoM annualized PPI inflation (bold blue), core PPI inflation (tan), instantaneous core PPI inflation (τ=12,a=4) (green). Dates of peak-to-trough recessions as defined by NBER are shaded in gray. Source: BLS from FRED and authors’ calculations.
Core instantaneous inflation (τ=12, a=4) is significantly lower than core m/m.
Figure 2 shows instantaneous CPI and PPI (manufactured goods and services) inflation.
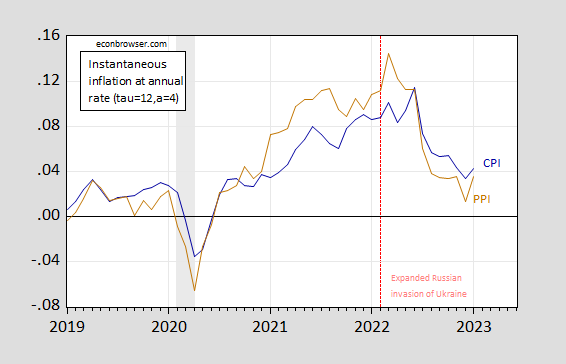
figure 2: Transient CPI inflation (τ=12, a=4) (dark blue) and transient PPI inflation (τ=12, a=4) (brown). Dates of peak-to-trough recessions as defined by NBER are shaded in gray. Source: BLS from FRED and authors’ calculations.
Markets are combining the core PPI data with retail sales and CPI data, suggesting that inflation is higher than a week ago and therefore the terminal fed funds rate is also higher than a week ago.

