

Below are some macro indicators of the real economy on a weekly frequency.
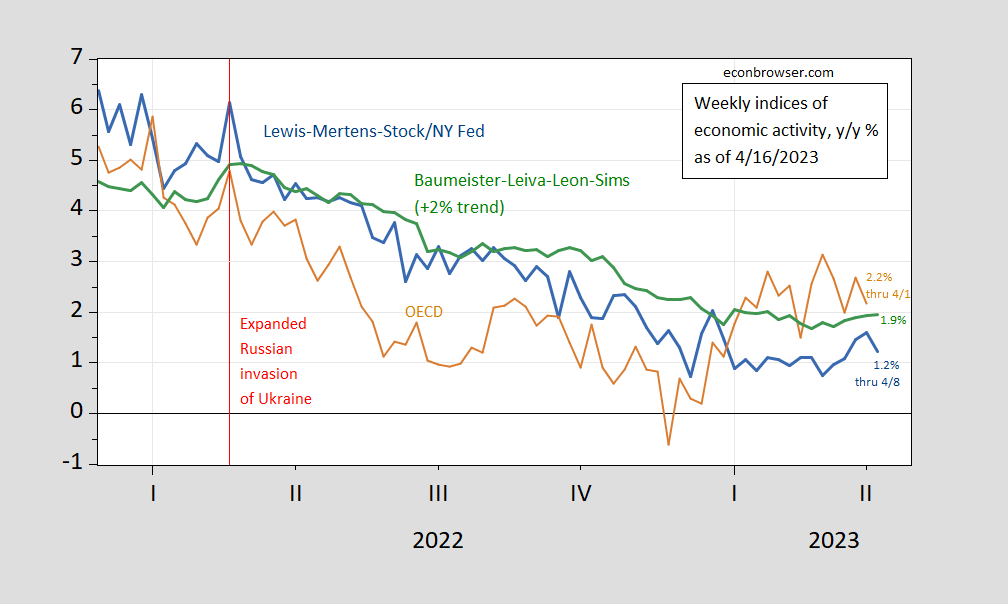
figure 1: Lewis-Mertens-Stock weekly economic index (blue), OECD weekly tracker (tan), Baumeister-Leiva-Leon-Sims weekly U.S. economic conditions index plus 2% trend (green), S&P Market Intelligence monthly GDP (blue bars), all growth rates (%).Source: New York Fed via fred, OECD, WECIaccessed 4/16, and author’s calculations.
The Weekly Tracker was not updated, so I repeated the 2.2% growth rate for the week ending April 1st. The WECI +2% to 4/8 is (1.9%), while the WEI reads 1.2%. The latter could be interpreted as a 1.2% quarter-over-quarter increase if the 1.2% reading persists throughout the quarter. Baumeister et al. A reading of -0.1% is interpreted as a growth rate of 0.1% below the long-term trend growth rate. US GDP growth averaged around 2% over the period 2000-19, so this translates to 1.9% annual growth through 4/8.
Recall that WEI relies on correlations of ten series available at weekly frequencies (e.g., unemployment claims, fuel sales, retail sales), while WECI relies on a mixed-frequency dynamic factor model. Weekly Tracker is a “big data” approach that uses Google Trends and machine learning to track GDP. As such, it does not itself depend on actual economic indicators.

