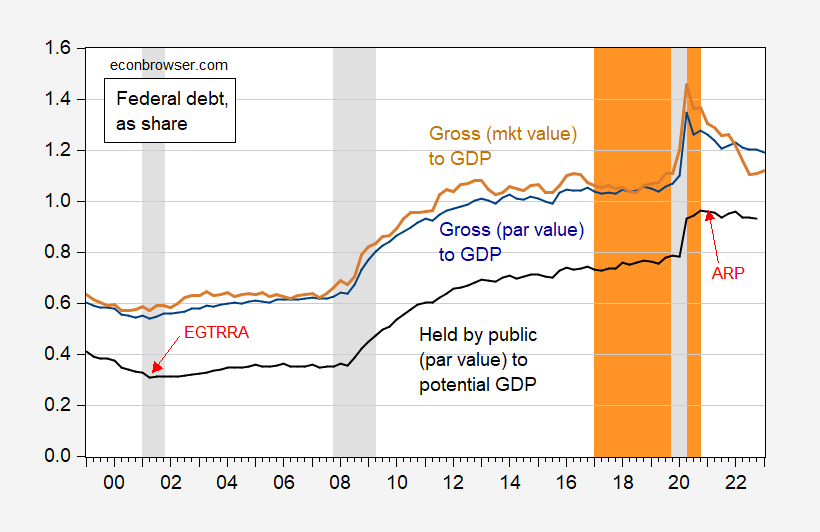
Whether gross or net, par or market, as a ratio to GDP or potential GDP, the answer is obvious.
figure 1: Gross federal debt at par to GDP (blue), gross federal debt at market value to GDP (tan), federal debt held by the public at par to CBO potential GDP ( black). Dates of peak-to-trough recessions as defined by NBER are shaded in gray. The Trump administration is shaded orange. Source: Treasury via FRED, dallas federal reserve bankCBO (February 2023), NBER, and author’s calculations.
From the first quarter of 2020 to the second quarter of 2020, public debt rose by 15 percentage points of potential GDP. The 25 percentage point increase using real GDP is misleading in the sense that it is largely due to a sharp drop in output in the second quarter.
The market value of debt has declined far more than face value, and in some respects market value is a better proxy for the burden posed by the stock of outstanding debt (see Discussion here).
None of this should weaken the argument that the debt path is unsustainable. What I’m saying is that given the consensus to maintain defense and social security, it’s impossible to meaningfully address this without raising additional revenue. (Measures to boost productivity and output, such as increased immigration, wouldn’t hurt either.)
(Side note: Japan’s 2021 net debt-to-GDP ratio is about 170%).