

It’s been a big data week and after the US inflation data I analyzed on Monday and the Australian wages data (analysed yesterday), we have Australian labor force data from the Australian Bureau of Statistics – Australian workforce – Today, July 2023 (August 17, 2023). Results for July showed softness (although the rotation of the sample contributed to this to some extent). Employment fell (particularly full-time employment), and the unemployment rate rose to 3.7% (up 0.2 percentage points). Currently, 10.1% of the available and willing working-age population is being wasted in one way or another—either unemployed or underemployed. This level of slack labor means Australia is not really close to full employment, despite claims by mainstream commentators. As I noted yesterday, wage growth is falling and moderate. We’ll see next month whether this weakness is actually a trend in line with other indicators (retail sales, etc.). Given that inflation has been falling since last September and wage pressures are absent, there is no reason for policymaking to try to put people out of work. This is just jerk behavior and ideological fanaticism.
The ABS July 2023 labor force (seasonally adjusted) estimates are summarized below:
- Employment fell by 14,600 (-0.1%) – full-time employment fell by 24,200 and part-time employment rose by 9,600.
- The unemployment rate increased by 35,600 to 541,000.
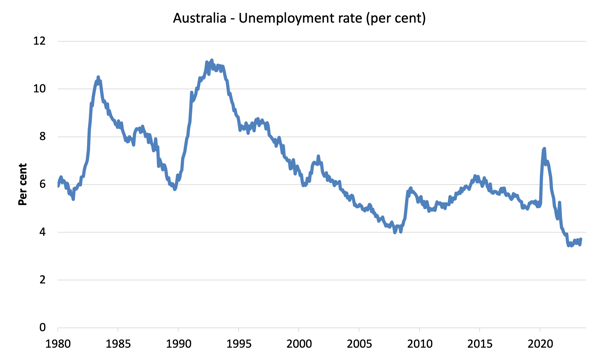
- The official unemployment rate rose 0.2 percentage point to 3.7%.
- The participation rate fell 0.1 percentage point to 66.7%.
- The employment-to-population ratio fell 0.2 percentage points to 64.3%.
- Total monthly hours worked increased by 4 million hours (0.2%).
- The underemployment rate was unchanged at 6.4%. In total, there are 929,900 underemployed workers. Total labor force underutilization (the unemployment rate plus underemployment) rose 0.2 percentage points to 10.1%. The total number of unemployed or underemployed workers was 1,470,800.
In its– media release – The ABS states:
The unemployment rate rose 0.2 percentage points to 3.7% in July…
In July 2023, monthly hours worked increased by 0.2%, while employment decreased by 0.1%. The increase in hours was partly due to fewer people than usual taking time off work during the school holidays.
Conclusion: Results for July suggest that the expected slowdown is taking place.
The media is now speculating on when the economy will fall into recession after the RBA hikes, and that will grow as more and more people abandon the fixed rates that protected them during the first phase of the RBA’s rate hike cycle.
Shamefully, monetary and fiscal policy settings have led to rising unemployment, while inflation has been falling since September last year, and there is no sign that the economy is running into overdrive.
Tuesday’s wage data also showed no wage pressures.
Employment falls by 14,600 in July 2023 (-0.1%)
1. The number of full-time employees decreased by 24,200, and the number of part-time employees increased by 9,600.
2. The employment-to-population ratio decreased by 0.2 percentage points to 64.3%.
The chart below shows the monthly growth in full-time (blue bars), part-time (gray bars) and total employment (green line) for the 24 months to July 2023, using seasonally adjusted data.
I took observations from September to January 2021 – they were outliers due to the COVID-19 pandemic at the time.
The table below provides an accounting summary Labor market performance over the past six months Provides a longer-term perspective, removes monthly variation and better assesses trends.
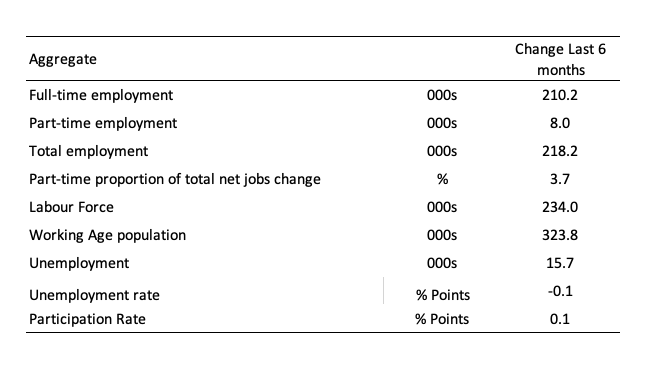
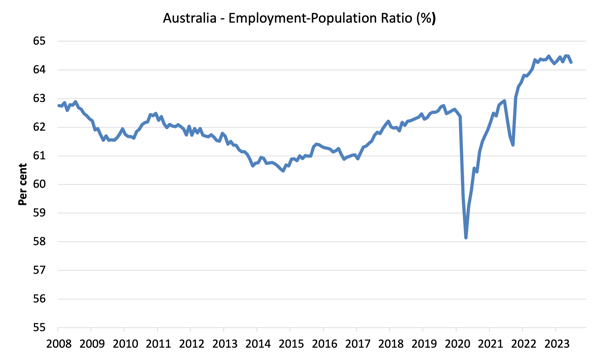
Given changes in labor estimates, it is sometimes useful to check labor estimates Employment Population Ratio (%) Because the base population estimate (the denominator) is less cyclical and prone to change than the labor force estimate. This is another measure of how robust economic activity is to the unemployment rate, which is sensitive to fluctuations in the labor force.
The graph below shows the employment-to-population ratio since January 2008 (ie since the global financial crisis).
In a sign of weakening conditions, the ratio fell 0.2 percentage points to 64.3% in July 2023.
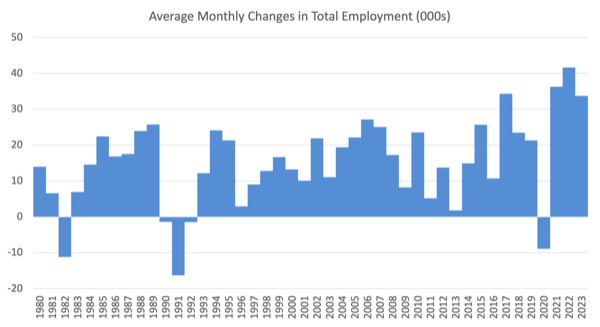
For perspective, the chart below shows the average monthly employment change for the calendar years from 1980 to 2022 (so far).
1. Average employment change of -8900 in 2020 and 36300 in 2021 as lockdown eases.
2. In 2022, the average monthly change will be 41,700.
3. The average change so far in 2023 is 33,700, which is a fairly rapid decline.
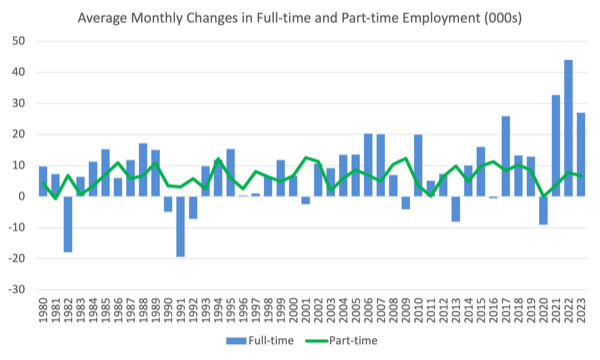
The graph below shows the average monthly change (in thousands) in full-time and part-time employment (bottom graph) since 1980.
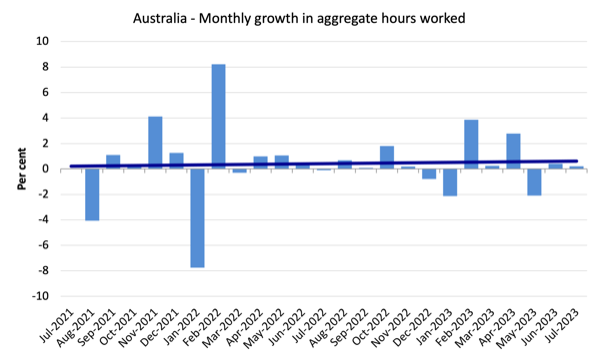
4 million more hours worked (0.2%) in July 2023
As noted above, this is due to a higher than usual number of people refusing to take furloughs (traditional school holidays) in July despite a decline in total employment.
The graph below shows the monthly growth rate (in percent) over the past 24 months.
The dark linear line is a simple regression trend (upward sloping due to several outlier results) of monthly variation.
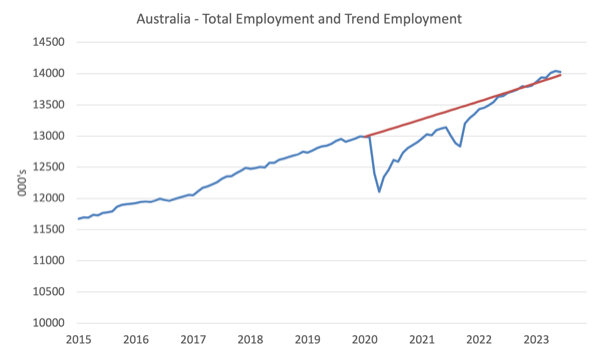
Actual Employment and Trend Employment
The Australian labor market is currently larger than it was in March 2020, with employment numbers now exceeding pre-pandemic trends.
The chart below shows total employment (blue line) and what it would have been if growth had continued at the average rate from 2015 to April 2020.
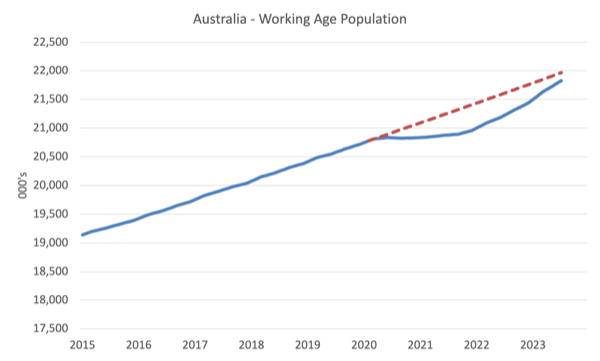
Population slowdown – “what-if” unemployment analysis
The graph below shows Australia’s working-age population (15+) from January 2015 to July 2023. The dashed line is the projected growth scenario for a continuation of the pre-pandemic trend.
The difference between the two lines is that the working-age population declined after the COVID-19 pandemic restricted immigration.
By July 2023, if pre-pandemic trends continue, the civilian population will decrease by 138,700.
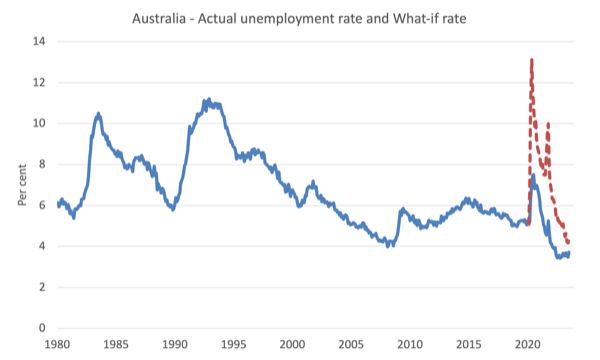
The graph below shows the evolution of the actual unemployment rate since January 1980 to July 2023, the dashed line is the “assumed” rate, calculated by assuming the most recent peak participation rate (recorded in July 2023 = 66.9%) ), the projected working-age population (based on growth rates from 2015 to March 2020), and actual employment since March 2020.
It shows what the unemployment rate would be given actual job growth if the working-age population trajectory followed past trends.
In this blog post – Closure of Australia’s external borders cut unemployment by about 2.7 percentage points (April 28, 2022), I provide a detailed analysis of how I calculated the “hypothetical” unemployment rate.
Therefore, given the employment performance since the pandemic, the unemployment rate would be 4.4% by July 2023 instead of the current 3.7%.
Unemployment rises by 35,600 to 541,000 in July 2023
It is uncertain whether this month marks a turning point in economic activity from strong economic activity and stable (relatively) low unemployment to a worse future.
There is some noise in the rotation groups in this month’s survey (groups with higher unemployment replacing groups with lower unemployment), so we’ll have to wait until next month to see if that matters.
In addition, a 0.1 percentage point drop in the participation rate also implies a smaller increase in the unemployment rate than would otherwise be the case. It was the second straight month of decline in the participation rate, which may reflect a slowdown in job creation.
The graph below shows the national unemployment rate from January 1980 to July 2023. Longer time series help to get some perspective on what’s going on right now.
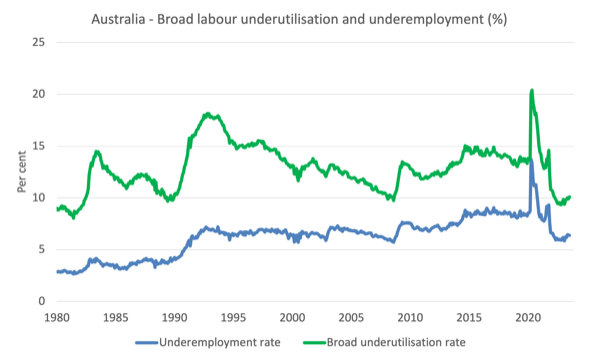
The overall labor underutilization rate increased by 0.2 percentage points to 10.1% in July 2023
1. The underemployment rate remained unchanged at 6.4%.
2. A total of 929,900 underemployed workers.
3. Labor underutilization (the unemployment rate plus underemployment) rose 0.2 percentage points to 10.1%.
4. The total number of unemployed or underemployed workers was 1.4708 million.
The chart below plots Australia’s seasonally adjusted underemployment rate from April 1980 to July 2023 (blue line) and the overall underutilization rate (green line) over the same period.
The difference between the two lines is the unemployment rate.
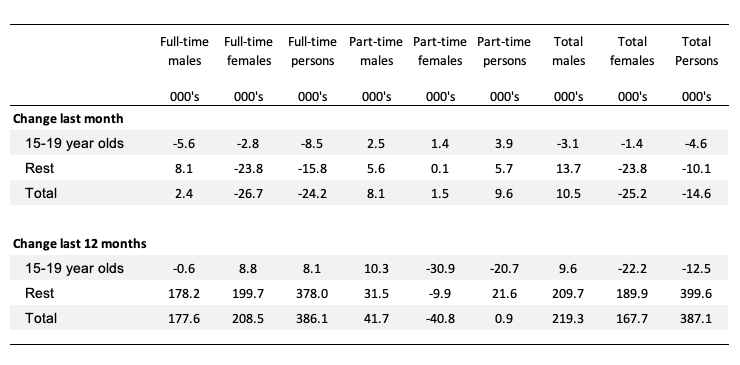
Youth labor market shrinks again in July 2023
Teenagers lost a net 4,600 jobs in July, with full-time jobs down 8,500 and part-time jobs up 3,900.
The table below shows the distribution of net job creation by full-time/part-time status and age/gender category (15-19 and others) for the past month and the last 12 months.
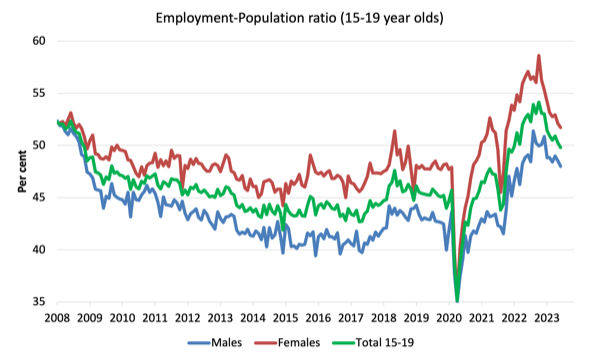
To put teen employment on a scale (relative to their size in the population), the graph below shows the employment-to-population ratios since July 2008 for males, females, and the total population ages 15-19.
You can interpret this graph as describing the change in employment relative to each cohort’s base population.
Judging from recent developments:
1. The proportion of males decreased by 0.5 percentage points month-on-month
2. The proportion of women decreased by 0.5 percentage points.
3. The overall employment-to-population ratio of young people decreased by 0.5 percentage points from the previous month.
in conclusion
My standard monthly caveat: Given the way the labor force survey is structured and conducted, we always have to be careful about interpreting the monthly shifts.
My overall rating is:
1. Results for July show weakness (although rotation of the sample contributes to this).
2. The employment rate fell (especially full-time employment rate), and the unemployment rate rose to 3.7% (up 0.2 percentage points).
3. 10.1% of the available and willing working-age population is being wasted in one way or another—either unemployed or underemployed. This level of slack labor means Australia is not really close to full employment, despite claims by mainstream commentators.
4. As I pointed out yesterday, wage growth is falling, and not by much. We’ll see next month whether this weakness is actually a trend in line with other indicators (retail sales, etc.).
5. Given that inflation has been falling since last September and there is no wage pressure, there is no reason for policymaking to try to put people out of work.
This is just jerk behavior and ideological fanaticism.
Enough for today!
(c) Copyright 2023 William Mitchell. all rights reserved.

