

I am in the final stages of relocating my office and it is a time consuming process. A regular research colleague of mine, Professor Scott Baum of Griffith University who occasionally blogs here, sent me some of his research in blog post form, time is limited today, this is is Scott’s latest guest post. Today he will be talking about a new analysis of financial insecurity that we are currently doing.
So in Scott’s words…
Regardless of what neoliberals think, many Australian communities have no financial buffer
Over the past 12 months or so, neoliberals have been keen to tell us that Australian households have built up important financial buffers, largely in the form of savings, as a result of restrictions imposed at the height of the COVID-19 pandemic.
When the Reserve Bank of Australia (RBA) started raising interest rates, the RBA board claimed (source):
Some households have large savings buffers…Households are willing to reduce current savings rates or draw on additional savings accumulated during the pandemic to cushion consumption from falling real incomes; a larger share of household income.
Similar information was shared in an article published in the RBA Bulletin (16 June 2022) – Household Liquidity Buffer and Financial Stress:
The ratio of Australian household liquid assets to household income has increased substantially in recent decades, both at the aggregate and individual household levels. The increase in buffers is most pronounced for households with mortgage debt and indebted households—the most indebted households generally have the highest liquidity buffers. This is important from a financial stability perspective, as liquidity buffers allow households to smooth out spending and maintain debt service obligations in the event of adverse shocks to cash flows; they are thus a key factor in reducing household financial stress.
So the RBA is trying to tell us not to worry about rising prices, housing costs and whatever, because we can all use our savings buffer.
Overall, it all sounds good.
But the total amount is problematic.
They hide significant heterogeneity in social and economic outcomes.
Consider the findings of this survey – Take the Pulse of the Nation Report (Published May 2023).
The report states:
Despite improvements in employment, Australians are still facing rising costs, leaving them short on funds for basic needs such as food, housing and healthcare spending. Vulnerability has not diminished over the past six months. Looking at eating enough, eating nutritious food, ability to pay utility bills, and meeting health needs as four separate challenges leading to financial vulnerability, 15% of the population reported one challenge and 34% reported two one or more challenges.
Then:
Financial stress has increased slightly over the past six months (August 2022 to February 2023). Today, more than half (53 per cent) of Australians say they are just making ends meet or worse.
So while many are exaggerating the numbers, there are still a considerable number of people who are under financial stress and are in danger of being overlooked.
Financial instability… coming to a suburb near you!
In a subject I currently teach, we often have broad discussions about how current social issues play out in different cities and communities.
Unsurprisingly, given the current circumstances, my students often turn to the subject of cost of living and financial (in)security, especially as many of them are moving to Australia for the first time away from home or from overseas and are attempting to live with little subsistence with financial support.
The topic of financial insecurity was appropriate given the students’ current focus on issues of social and economic disadvantage, and it was interesting to see them unpack some of these issues.
After a class discussion, I decided to try a measure of financial insecurity to complement the other indices Bill and I had worked on over the years.
For those interested, our – Employment Vulnerability Index – as well as- Australian Local Prosperity and Poverty Index – Measures employment vulnerability and economic prosperity at the Statistical Area 2 (SA2) level, you can explore the data through the links.
In large cities, SA2 is similar to suburbs or other large neighborhoods, so they have a good level of aggregation.
The idea is to develop an index to identify the geographic distribution of financial insecurity in the suburbs and elsewhere.
We’ll publish an in-depth report in due course, but a preliminary scan of the results revealed some interesting results.
The index draws on ideas from a research article in 2022 – A Multidimensional Approach to Measuring Economic Insecurity: The Case of Chile – Published in a magazine Social Indicators Research And focus on developing methods to measure economic insecurity.
The authors define financial insecurity as:
Adverse well-being effects of involuntary exposure to uncertainty while enduring uninsured financial shortfalls.
The authors also point out:
The idea behind this is that economic insecurity has a subjective component and is a forward-looking measure, as stress and anxiety are associated with financial uncertainty.
They suggest that financial insecurity can be measured by considering two dimensions:
The first dimension is the household’s risk of experiencing a potential event associated with negative economic consequences, such as job loss, loss of asset value, or unexpected medical expenses. …
The second dimension is the lack of household economic buffers, which create stress, such as not having enough assets to cover events of reduced income or increased spending, or the inability to use social protection mechanisms to offset these economic losses.
There is an interesting set of data available, the minimum requirements are:
- as a reasonable measure or proxy for one of the dimensions, and
- Available at the aggregated space level available.
The first dimension can be measured by the percentage of the population in SA2 receiving income from government payments or the percentage of households facing mortgage or rent stress.
The second dimension can be measured by considering the amount of bank interest received per person and the amount of dividend income received, wages and salaries per person, the percentage of people who said they could not afford to spend the night, and the percentage of inaccessible emergency funds. people.
The main conclusion from the initial preliminary analysis is that financial insecurity is concentrated in highly disadvantaged communities.
There are no surprises here.
As always, those who suffer most socially and economically continue to be haunted.
But it’s not just the most vulnerable who are under pressure.
The analysis also revealed that there is another category of places classified as suffering from extreme financial insecurity.
These places are not generally considered to be at a serious disadvantage, but may come under increasing pressure given their level of financial insecurity.
The caveat to this research is that the data does not take into account the extreme price increases in the recent period, so we can imagine the status of both sets of places being amplified.
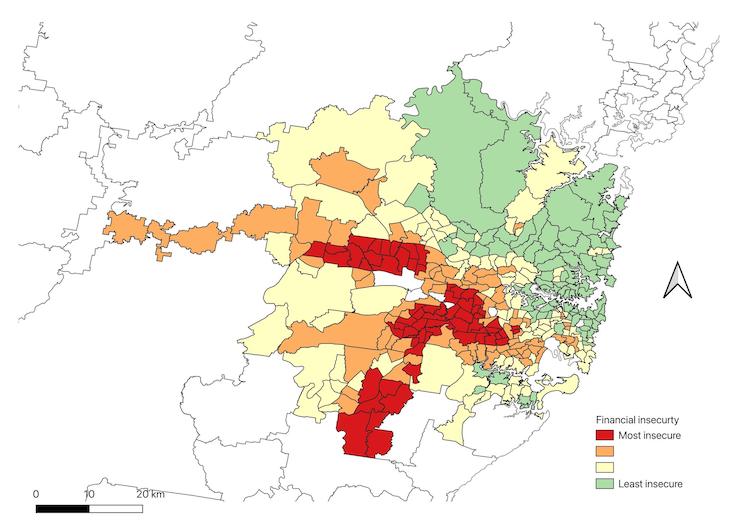
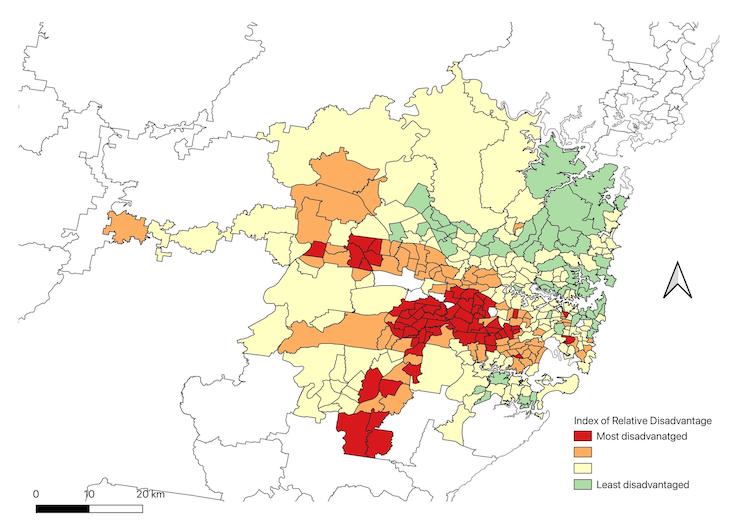
The results for Sydney (Australia) provide a good illustration.
If we compare the results of our Financial Insecurity Index with those of the Australian Bureau of Statistics SEIFA Relative Weakness Index, we can see some patterns emerge.
The scatter plot represents SA2 at various points on the continuum from high to low, with points above the y-axis representing the most financially insecure points and points to the right of the x-axis representing the most relatively disadvantaged points.
The second quadrant represents the SA2 group with high relative disadvantage and high financial insecurity. Quadrant 1 represents those SA2 countries that, while not the most disadvantaged, are still considered to suffer from high levels of financial insecurity.
These two maps illustrate the spatial distribution of these two measures across Sydney.
The first is a measure of financial insecurity and the second is the ABS SEIFA measure.
The distribution is relatively clear.
SA2 clusters (or hotspots) located to the west and southwest of the city are classified as highly vulnerable, while larger clusters in the same area are classified as suffering from high financial insecurity.
Financial Insecurity: Another Dimension of a Dying Community
Financial insecurity is one indicator of future community demise.
For communities facing severe financial insecurity, even small shocks can have major and widespread effects.
If we borrow from the literature on resilience, we would say that financial insecurity is a measure of the ability of individuals, households, and communities to withstand shocks and bounce back.
Bill and I currently have a large Australian Research Council grant to study the resilience of regions to rebound from economic shocks.
The Financial Insecurity Index adds a smaller-scale component to this work.
The level of resilience in financial security is being tested in communities across the country, which should further alarm bells for more government action.
The spatial concentration of financial insecurity we find should be of particular concern.
We have pointed this out in some other work:
1. People, Space and Place: A Multidimensional Analysis of Unemployment in Metropolitan Labor Markets (published in geographical study 28 January 2010).
2. Happy People in Mixed Areas: The Relationship Between the Degree and Type of Local Socioeconomic Mixing and Neighborhood Satisfaction Expressions (published in urban studies 7 December 2009).
–Self-Assessment of Health Status and Neighborhood Environment (Published on Journal of Community Prevention and Intervention 11 August 2016).
The concentration of disadvantage in large parts of a city, town or region has a cascade of knock-on effects for those who live there, driving many further into the abyss of disadvantage.
Financial insecurity made the situation worse.
But things seem to keep going in the same direction.
Our central banks have lost the ability to deal with inflation, and our governments are unwilling to take meaningful, sustainable steps to address stress on households and households.
Governments and others appear unwilling to accept that their decisions could further disadvantage already-distressed communities, and potentially leave others in trouble.
They can only talk about taking responsible steps to relieve family stress, which seems to give little endorsement to those most in need.
We’ve said it time and time again.
in conclusion
Our most vulnerable groups deserve better.
The government can do something meaningful.
This will translate into a just and sustainable transformation of our societies and economies.
Instead, they appear to be standing by and maintaining the status quo.
not good!
We can do better!
Enough for today!
(c) Copyright 2023 William Mitchell. all rights reserved.

