

Today (February 15, 2024), the Australian Bureau of Statistics released the latest data – Australian workforce – January 2024, which confirms the weakness of the labor market. Signs of a slowdown emerged toward the end of 2023, and January data may confirm this trend, although changes in holiday behavior make it difficult to be sure. We'll know more next month, when the holiday fallout wears off. Job growth isn't even keeping pace with underlying population growth, which is why the unemployment rate is rising with the participation rate unchanged. The best indicators of labor market weakness are the decline in the employment-to-population ratio since November 2023 (down 0.5 percentage points) and the sharp decline in hours worked over the past few months. The economic slowdown appears to be disproportionately affecting teenagers. Currently, 10.7% of the working-age population who are available and willing to work are being wasted in one way or another – either unemployed or underemployed, and this proportion is increasing. While mainstream commentators claim Australia is not close to full employment, it is difficult to describe it as a “tight” labor market.
ABS January 2024 labor force (seasonally adjusted) estimates are summarized below:
- Employment increased by 500 people (0.0%) – full-time employment increased by 11,100 people and part-time employment decreased by 10,600 people. Part-time jobs account for 30.5% of the total.
- The unemployment rate increased by 22,300 to 600,600.
- The official unemployment rate rose to 4.1% (+0.2 percentage points).
- The participation rate held steady at 66.8%.
- The employment-to-population ratio fell by 0.1 percentage point to 64.1%.
- Total monthly hours worked decreased by 49 million hours (-2.5%).
- The underemployment rate increased by 0.1 percentage points to 6.6% (+20,300). There are a total of 993,500 underemployed workers. The labor underutilization rate (unemployment rate plus underemployment) increased by 0.3 percentage points to 10.7%. The total number of unemployed or underemployed workers was 1,584,100.
Released in ABS Media – Unemployment rate rose to 4.1% in January – ABS states:
As employment remained stable, the number of unemployed people increased by 22,000, and the unemployment rate rose to 4.1% in January.
…This is the first time in two years since January 2022 that the unemployment rate has exceeded 4%…
Since October 2023, annual growth in hours worked has slowed sharply, falling to 0.7% in January 2024, well below the 2.6% annual employment growth rate…
Conclusion: January's results are difficult to determine because holiday leave patterns have changed since the pandemic, with more people not working during the month.
Apparently, many people who worked odd hours in January said in the survey that they would return to work in February.
However, the fact remains that hours worked have continued to fall over the past few months, pointing to a general slowdown in spending growth, which is already evident in the retail sales data.
Additionally, the employment-to-population ratio, a fairly reliable measure of labor market strength, has fallen by 0.5 percentage points since November 2023, suggesting that labor market slack is intensifying.
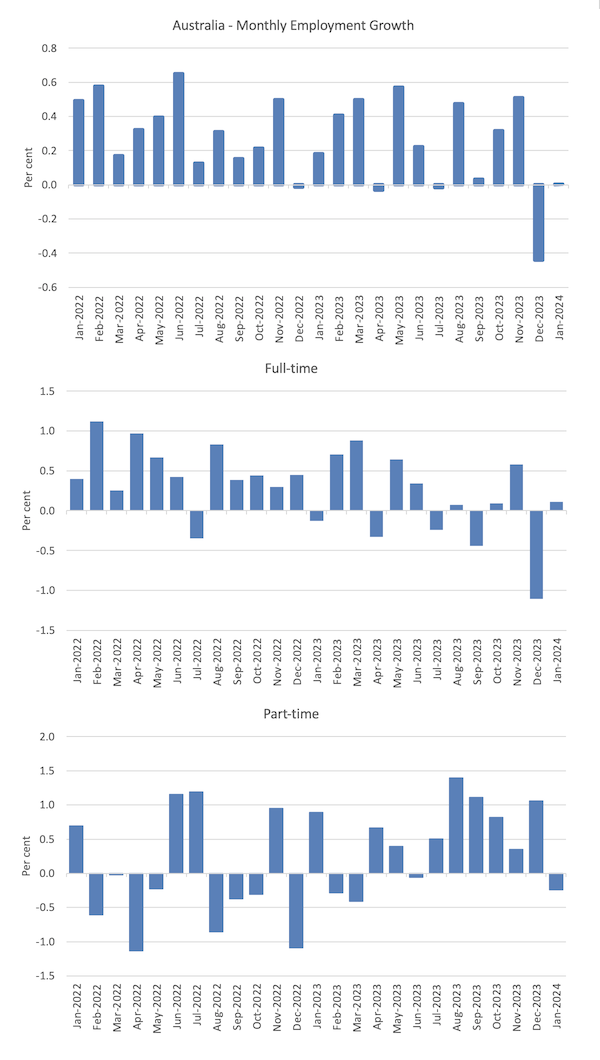
Employment increased by 500 people in January 2024 (0.0%)
1. The number of full-time employees increased by 11,100 (0.1%), and the number of part-time employees decreased by 10,600 (-0.2%).
2. The employment-to-population ratio dropped by 0.1 percentage points to 64.1%.
The chart below shows the month-over-month growth in total employment, full-time employment and part-time employment using seasonally adjusted data for the 24 months to January 2024.
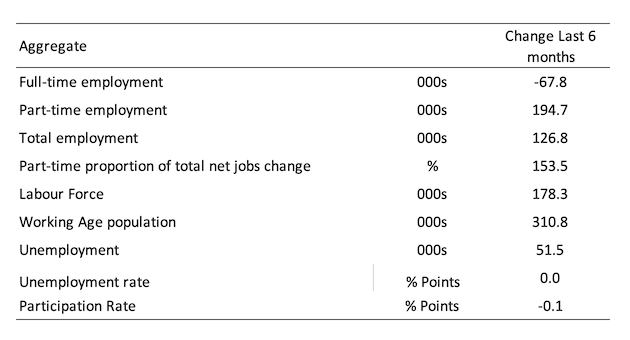
The following table provides an accounting summary Labor market performance over the past six months Provides a longer-term perspective, smoothing out month-to-month variations and better assessing trends.
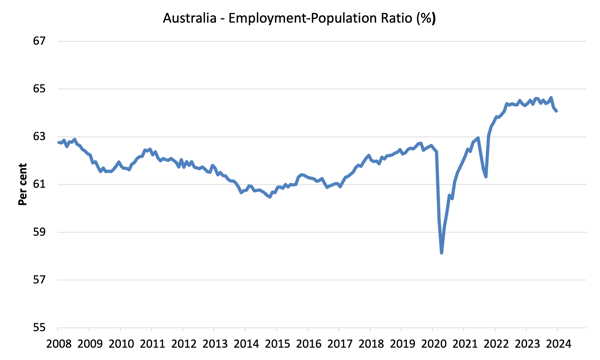
Given changes in labor estimates, it is sometimes useful to check labor force estimates Employment-to-population ratio (%) Because the underlying population estimate (the denominator) is less cyclical and easier to change than the labor force estimate. This is another measure of how robust economic activity is to the unemployment rate, which is sensitive to labor fluctuations.
The chart below shows the employment-to-population ratio since January 2008, the time of the global financial crisis.
In January 2024, the ratio fell by 0.1 percentage points to 64.1%.
After a long period of stability, the employment-to-population ratio is now declining, down 0.5 percentage points since November 2023.
This is a good sign that the labor market is currently struggling under the dual impact of rising interest rates and government fiscal surpluses.
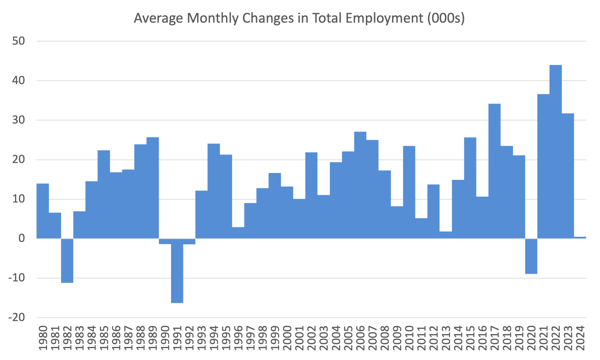
The chart below shows average monthly employment changes for calendar years from 1980 to 2023.
1. The average employment change in 2020 was -8,900, rising to 36,600 in 2021 as lockdowns eased.
2. In 2022, the average monthly change will be 44,000, and in 2023, the average monthly change will be 31,800.
3. Until 2024, the change is 0.5 thousand.
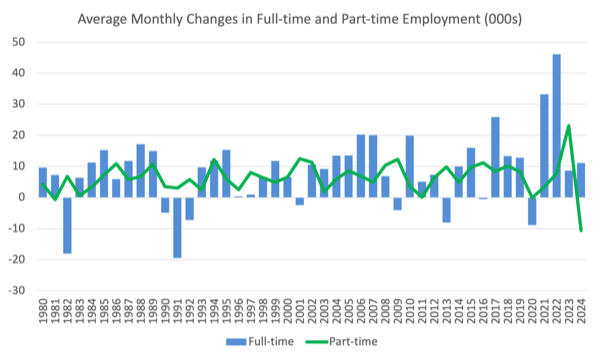
The chart below shows the average monthly change in full-time and part-time employment since 1980 (in thousands).
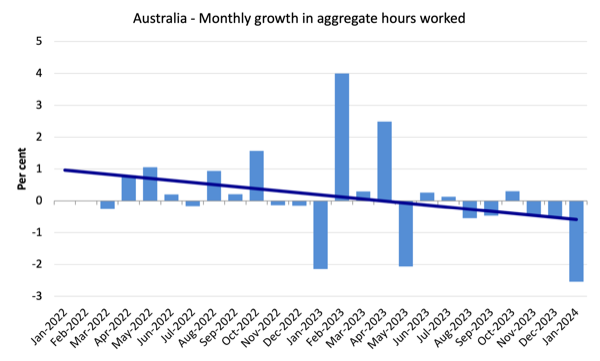
In January 2024, total monthly working hours decreased by 48.8 million hours (-2.54%)
The relatively large fall in working hours may reflect behavioral changes around holiday time – there is evidence that more people were working zero hours in January than before.
But hours worked have fallen for three consecutive months, which could signal a weakening labor market.
The chart below shows monthly growth (in percent) over the past 48 months (omitting the period of pandemic restrictions).
The dark linear line is a simple regression trend of monthly changes.
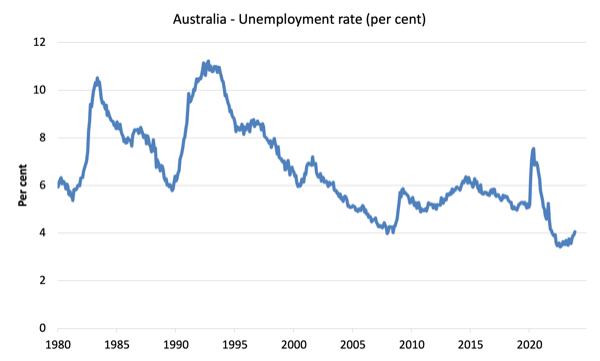
Unemployment rate increased by 22,300 to 600,600 in January 2024
The unemployment rate rose this month because job growth was so weak that it failed to absorb underlying population growth.
The chart below shows the national unemployment rate from January 1980 to January 2024. Longer time series help to develop some perspective on what is happening now.
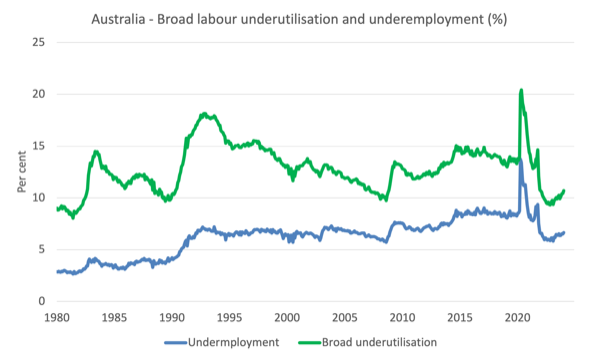
In January 2024, the broad labor utilization rate increased by 0.3 percentage points to 10.7
1. The underemployment rate increased by 0.1 percentage points to 6.6% (+20,300).
2. There are a total of 993,500 underemployed workers.
3. The total labor underutilization rate (unemployment rate plus underemployment) increased by 0.3 percentage points to 10.7%.
4. The total number of unemployed or underemployed workers is 1.5841 million.
This means that 10.7% of available and willing workers are in some way out of work (unemployed or underemployed), which makes a mockery of claims by economic commentators and policy officials that Australia is close to full employment or has a tight workforce. market.
The chart below plots Australia's seasonally adjusted underemployment rate from April 1980 to January 2024 (blue line) and the overall underutilization rate for the same period (green line).
The difference between the two lines is the unemployment rate.
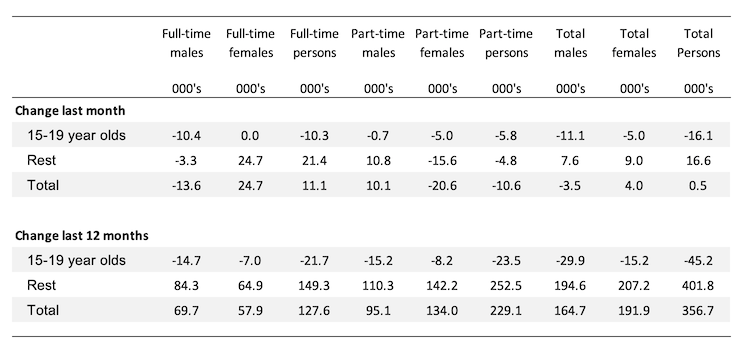
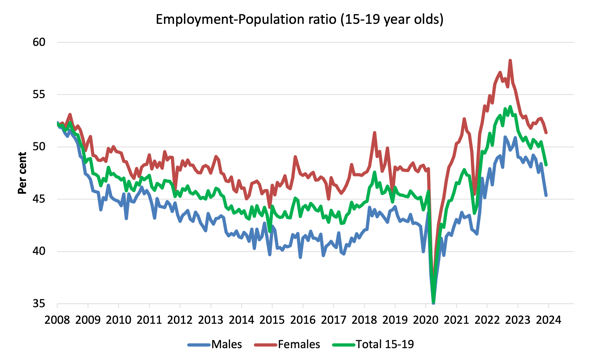
The youth labor market deteriorated sharply in January 2024
The overall number of youth employment dropped by 16,100, of which full-time employment dropped by 10,300 and part-time employment dropped by 580,000.
The table below shows the distribution of net job creation by full-time/part-time status and age/gender category (15-19 and other) last month and the last 12 months.
To put youth employment into a scale (relative to their size in the population), the chart below shows the employment-to-population ratio for men, women and the total population aged 15-19 since July 2008.
You can interpret this graph as describing changes in employment relative to the underlying population for each cohort.
Judging from recent developments:
1. The proportion of men decreased by 1.5 percentage points quarterly.
2. The proportion of women decreased by 0.8 percentage points quarterly.
3. The overall youth employment-to-population ratio dropped by 1.1 percentage points from the previous month.
The chart shows that employment opportunities for the growing teen population have continued to deteriorate since November 2022.
The Reserve Bank of Australia's deliberate desire to create unemployment in Australia may hurt this group of people more than anyone else.
As the population ages, this group is the workers of the future and we will rely on them to increase productivity.
Sabotaging their job opportunities at an age when they are about to gain skills and experience is smart policy (not!).
in conclusion
My standard monthly caveat: Given the way labor force surveys are constructed and administered, we always have to be cautious in interpreting monthly changes.
My overall rating is:
1. There are signs of an economic slowdown in late 2023, and January's data may confirm this trend, although changes in holiday behavior make it difficult to be sure.
We'll know more next month, when the holiday fallout wears off.
2. Employment growth cannot even keep pace with underlying population growth, which is why the unemployment rate rises with a constant participation rate.
3. The best indicators of labor market weakness are the decline in the employment-to-population ratio since November 2023 (down 0.5 percentage points) and the sharp decline in working hours over the past few months.
3. The economic slowdown appears to be disproportionately affecting teenagers.
4. 10.7% of the working-age population who are available and willing to work are currently wasted in one way or another – unemployed or underemployed, and this proportion is increasing.
5. Although mainstream commentators claim that Australia is not close to full employment, it is difficult to describe it as a “tight” labor market.
That's enough for today!
(c) Copyright 2024 William Mitchell. all rights reserved.

