


Measuring page speed It’s important to debug slow websites.
All Chrome browsers have built-in tools to help troubleshoot slow pages and poor performance.
The great thing about Chrome and Firefox-based browsers is that they can be extended with tools that make troubleshooting a site quick and easy.
Both Chrome and Firefox support browser plugins.
Firefox calls them add-ons, and in the Chrome ecosystem they are extensions.
Browser extensions and add-ons extend the functionality of the browser in a way that is customized to the user’s needs.
Why use the Page Speed browser extension
Browser-based debuggers such as Chrome Dev Tools Is a collection of tools, like a toolbox.
If you only want one tool, you’re out of luck, as the browser serves the entire collection at once.
This means that publishers need to first learn how to navigate all the different menus, tabs, and screens, many of which offer tools that aren’t necessarily the overview you might want.
That’s why extensions are an effective alternative to using built-in troubleshooting tools in your browser.
You can simply choose the exact tools you want and skip the learning curve to get the metrics you really need when you need them.
Google Lighthouse extension for Chrome and Firefox
lighthouse is a good tool for getting easy to understand Web page performance overview There is an option to dig deeper for diagnostic feedback and suggestions to speed up web pages.
There is a separate Google Lighthouse web page, but you must copy the URL of the page where you want to get the data, then navigate to the Lighthouse tool.
With the Lighthouse extension, the full functionality of the tool is available at the click of a button.
All you have to do is click the extension icon and then click the blue Generate Report button.
The Lighthouse extension will generate a new browser tab and generate a full Lighthouse report.
The new web page will display a waiting screen while Lighthouse generates the report.
 Google Lighthouse waiting for screenshots, March 2022
The top of the Lighthouse page has a numerical score for the web page.
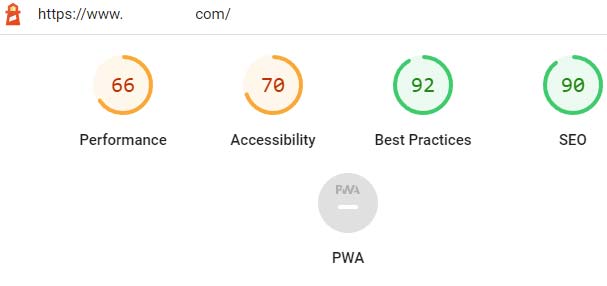 Screenshot of Google Lighthouse overview, March 2022
And, if you scroll down, you can see in-depth data that can help diagnose and solve problems.
All you have to do is click the link to get more information on what the problem is and advice on how to fix it.
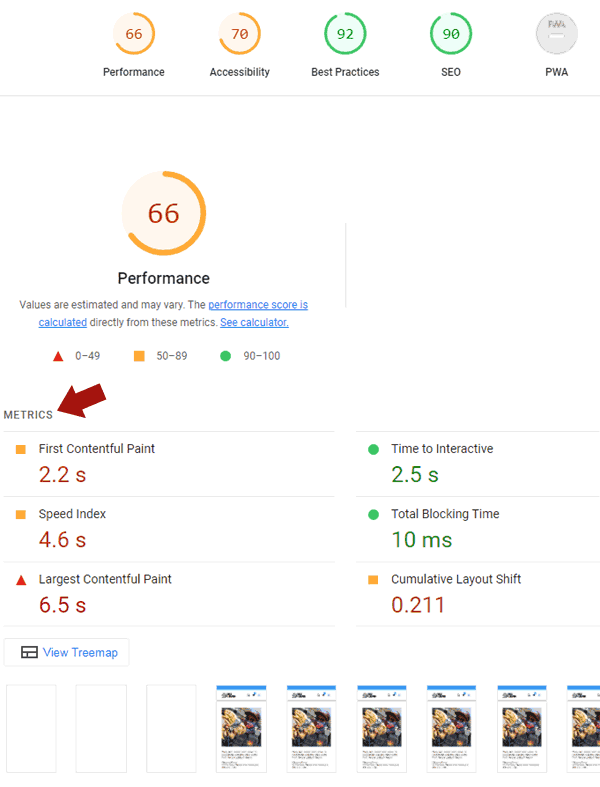 Screenshot of the March 2022 Google Lighthouse full-page report
Google has developed Lighthouse versions for both Chrome alloy and Firefox.
Page Load Time Browser Extension
The Page Load Time browser extension for Chrome and Firefox provides highly accurate page load metrics because it uses the Navigation Timing API, which is available in Mozilla developer page for Navigation Time API.
This browser extension has been installed over 100,000 times and rated 258 times.
Once installed, all you have to do is visit a page and look at the page load time icon in the upper right corner of your browser.
The icon automatically reports the time it takes to download a web page.
 Page Load Time Browser Extension Icon
Clicking the icon reveals more details about the various factors that more fully explain why a page is downloading so fast or so slowly.
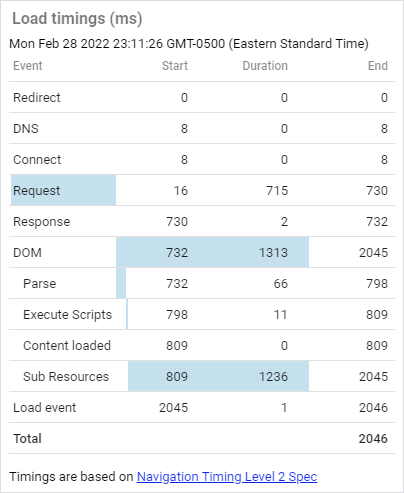 Screenshot of page load time browser extension details, March 2022
As you can see in the image above, the Page Load Time browser extension displays a wealth of information organized in an easy-to-understand format.
Detailed reports show latency caused by redirects, DNS response time, and connection time.
The report also calculates the response time from the start of the web page request and the elapsed time to completion.
There are precise measurements of how long the script takes to execute, the time it takes for the content to load, and how long it takes for the page to finally load.
This is a lot of information displayed in an easy to understand way.
This is Page Load Time Extension for Chrome and Loading timer plugin for Firefox.
Performance Analyzer
This Performance Analyzer Extension for Chrome Browser Just like the page load time browser extension, only it goes a step further in what it covers.
It uses resource, navigation and user timing APIs
This extension generates colored pie charts to provide a visual representation of various metrics, such as requests by domain, and provides navigation time API information in a convenient waterfall chart to visualize presentation times.
According to the description:
“Performance-Analyser (aka Performance-Analyzer) helps analyze the current page through resource, navigation, and user timing APIs – instantly see requests by type, domain, load time, tags, and more.”
page size checker
This Page Size Checker Extension for Chrome Especially useful because it provides a snapshot of various metrics, including how many requests were made for fonts and what was the uncompressed size of the download.
What makes this extension stand out is the easy-to-understand interface and the byte size of the following web resources:
- HTML
- JS
- CSS
- picture
- Ajax
- font
The Chrome browser extension also provides download times in seconds for a quick and easy overview of page speed metrics right at your fingertips on the page.
Checkbot: SEO, web speed and security tester
This extension aggregates several tools related to SEO.
What’s interesting about this extension is that it provides data that helps to better understand why webpages take as long to download as they do.
The plugin reports the following variables:
- document zoom out.
- Network compressed information.
- file cache.
- Render blocking CSS and JavaScript.
- Duplicate CSS and JavaScript.
- Too much inline CSS and JavaScript.
- redirect and redirection of links.
All of the above data points are very useful for understanding issues that may need to be fixed.
As a bonus, Chrome Checkbot: SEO, Web Speed and Security Tester The extension also provides a variety of SEO-related data, one of my favorites is the security header data, which can tell you if your site is insecure due to a lack of security headers.
Page Speed browser extension
Page speed browser extensions are very useful for publishers and developers.
They can help you quickly identify problems right away without having to open another web page and then paste the URL into another website.
Page speed diagnostics can be done automatically or at the click of a button when you visit a website.
More resources:
Featured Image: StudioByTheSea/Shutterstock


