

Facebook ads are an important part of many businesses’ digital marketing strategies.
Whether the goal is to build awareness or generate sales and revenue, measuring and reporting campaign performance can be challenging.
You might be wondering, is my Facebook ad working? Or should I invest my marketing budget elsewhere?
The Facebook Ads platform allows you to create reports with data sliced and diced in many different ways to gain insight into the performance of your ads.
However, Facebook Ads reports can be overwhelming and confusing.
Even a simple dashboard can help you raise the bar and take your reporting to the next level.
In this column, you’ll learn how to use the Google Data Studio dashboard to do just that for your Facebook ad performance reports.
Why You Need a Facebook Ads Dashboard
There’s no shortage of reporting solutions, but we think Google Data Studio tops the list.
It’s easy to use, fast, and best of all, it’s free.
There are some additional benefits, firstly you are able to import data locally Google Analytics.
This means you can measure the performance of your Facebook marketing campaigns and compare them to the performance of other channels.
Additionally, dashboards enable you to easily manipulate data and present it in multiple reports or charts.
But that’s not all. From the user’s point of view, Dashboard It is easier to manage than reporting when analyzing and comparing datasets and/or date ranges.
How to Get Started with Google Data Studio and Facebook Ads
While Google Data Studio is an amazing tool in a digital marketer’s arsenal, integrating Facebook Ads data requires a few extra steps compared to Google’s native platforms like Google Ads, Google Analytics, etc.
Do not be afraid. Countless manual and automated solutions allow you to import data from Facebook Ads into Data Studio.
No matter which way you choose, you should still be able to implement beautiful and valuable dashboards for you and your business.
Import data manually
Let’s start by importing the data manually.
1. Export data
The easiest way to do this is to create a downloadable report in Facebook Ads.
Note that if you want to measure ad success by platform (i.e. Facebook, Instagram, etc.) and/or placement (Instagram Stories, Feed, right hand column, etc.), you will not be able to see metrics such as purchases, purchase conversion value or per cost of purchase.
That level of data is not available on the (Facebook Ads) platform, so no matter how you extract the data, whether it’s via API, a connector, or manual download as in our case, there’s no way to access it via the data.
Conversion data is only available at the top level.
If you want to understand your ad’s performance and measure its ROI (return on investment) or ROAS (return on ad spend), all you need to do is download data broken down by campaign, ad group and/or time.
You can still create and download additional reports that break down data by delivery, and therefore by platform and placement.
However, this will only show you performance metrics such as impressions, reach, clicks, CPC (cost per click), CPM (cost per thousand impressions), etc.
It’s still a good case to use this data to evaluate and understand how our ads are performing on each platform and placement, and to use this experience to optimize campaign delivery.
step 1: go to Advertising report and create a new report.
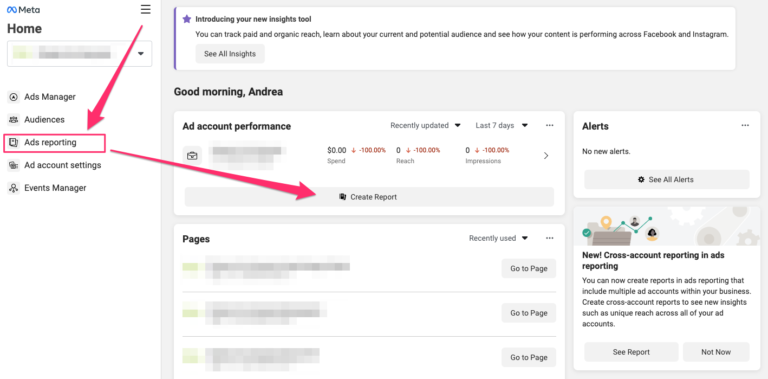 Screenshot of Facebook Ads Manager, June 2022
Step 2: Select metrics and dimensions for your report.
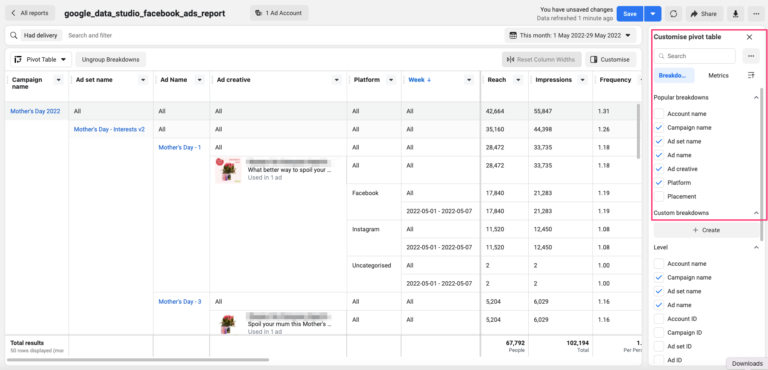 Screenshot of Facebook Ads Manager, June 2022
Here, it’s important that you keep in mind the end result and what data the dashboard needs.
Step 3: Schedule a report.
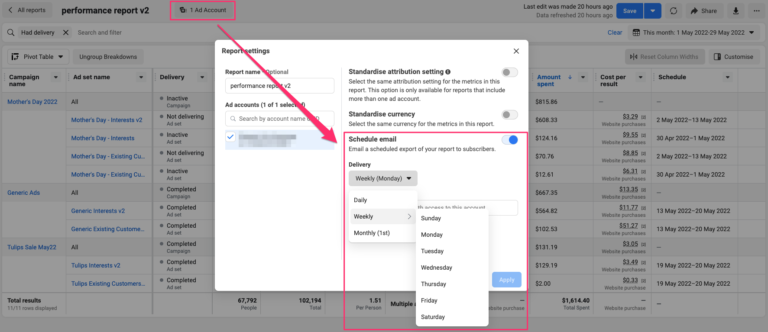 Screenshot of Facebook Ads Manager, June 2022
This is optional, but having reports delivered to your inbox instead of downloading them every time will make your life easier!
Step 4: You may need to manipulate data.
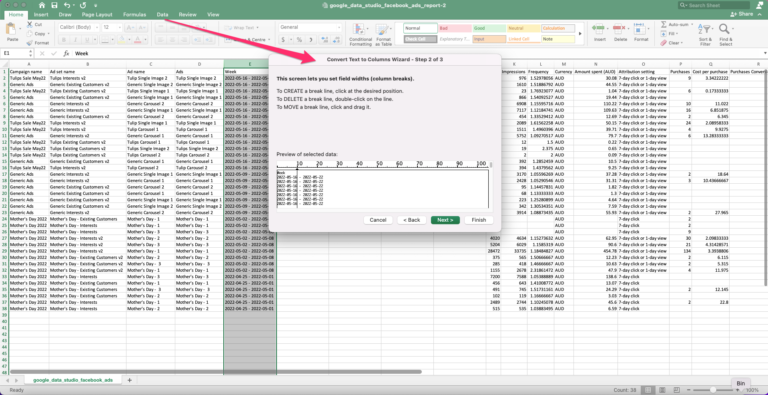 Screenshot by author, June 2022
Aligning data downloaded from Facebook Ads may require some small changes.
In the example above, we changed the date column to make sure Google Data Studio recognizes it.
2. Import data
After downloading the data in CSV or Excel format, you can import it into Google Sheets.
Step 5: From Excel to Google Sheets.
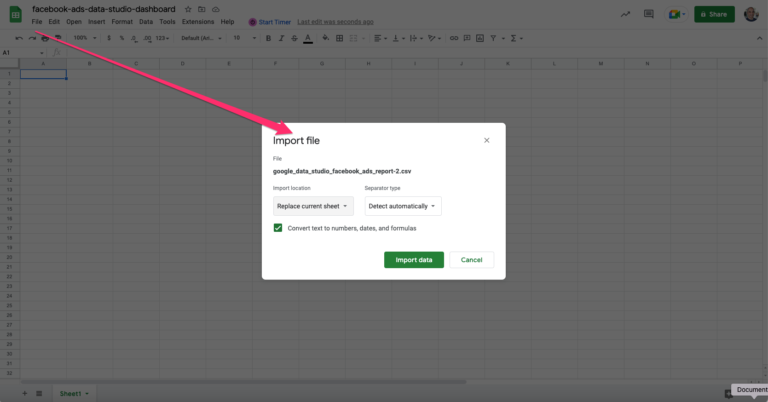 Screenshot of Google Sheets, June 2022
If you have scheduled reports to be emailed on a regular basis, whether daily, weekly, or monthly, you can automate some of the steps above.
Solutions like Zapier allow you to set up automatic import of data from email attachments into Google Sheets.
Since this can vary from setup to setup, we won’t cover that process in this guide. However, a quick Google search should help.
After importing the data, connect the worksheet to Data Studio as the data source.
Step 6: adding data.
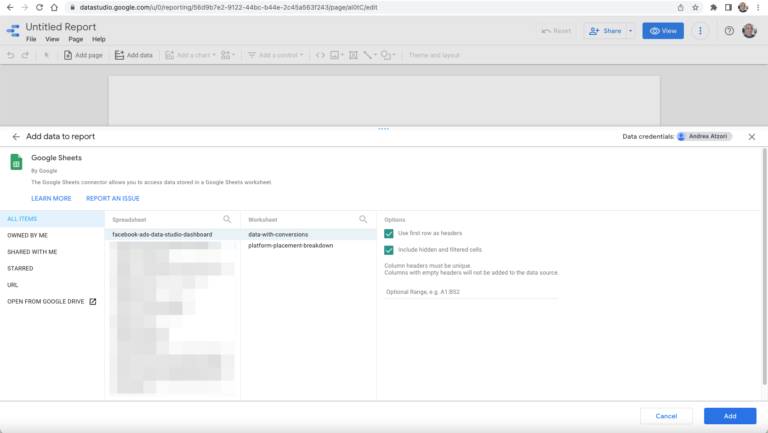 Screenshot of Google Insights, June 2022
You only need to connect Google Sheets to the Data Studio dashboard once.
Once connected, any changes to the data in the worksheet will be reflected in the dashboard.
When adding data to Data Studio from CSV or Google Sheets, there are some very important things to keep in mind.
When combining and aggregating data, be careful with metrics such as coverage and frequency, and calculated metrics such as CPC, CPM.
More details in a few minutes. At the same time, we can start designing and building our dashboard.
Design and build dashboards
Step 7: Start adding some design and functional elements.
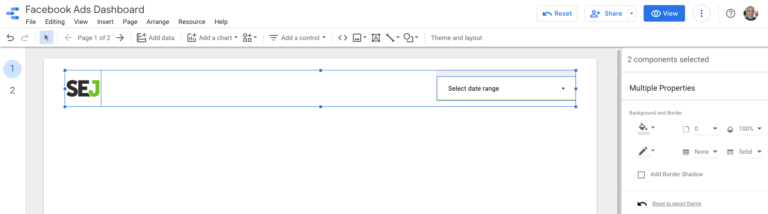 Screenshot of Google Insights, June 2022
We added the logo and date range controls to the example and set them to “Report Level”.
This means that these elements will be copied to all pages of our dashboard, which is very convenient!
From here, the options are endless.
Step 8: Change themes, add data with scorecards and tables, visualize it with charts, and more.
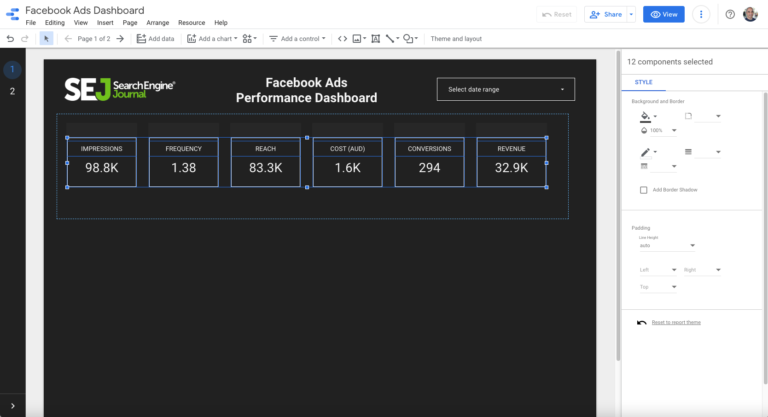 Screenshot of Google Insights, June 2022
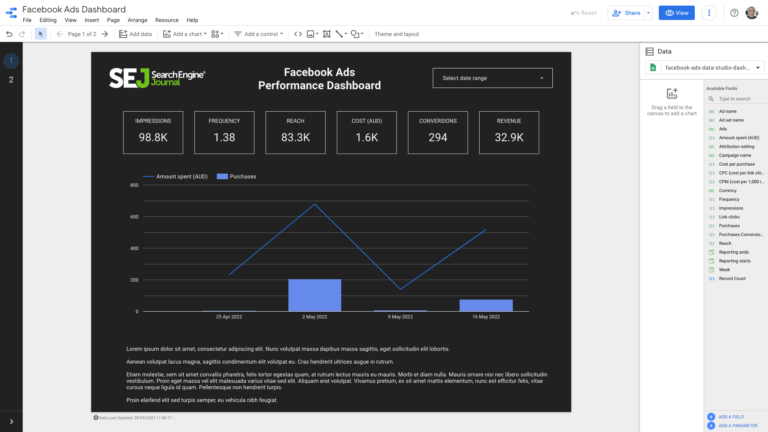
We start with several scorecards to show top performance and KPIs in our example.
 Screenshot of Google Insights, June 2022
You can also add free text to include comments, insights, and suggestions.
Step 9: Add additional functionality to your dashboard.
 Screenshot of Google Insights, June 2022
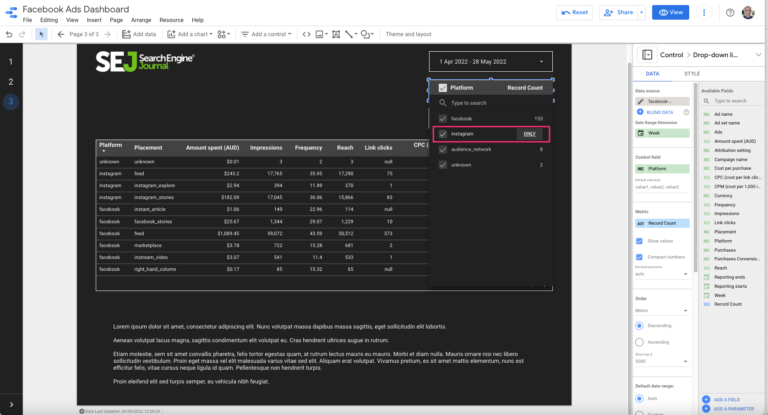
You can now customize your page and how you access your data with filters, segments, sliders, dropdowns, and more.
Going back to our example, the screenshot above shows how using a dropdown list can zoom in on a subset of data.
Here we have the option to segment it by platform (i.e. Instagram, Facebook, etc.).
rinse and repeat
These are the basic steps for you to create a data insights dashboard for Facebook ads.
It’s that easy.
You can add new data sources, bring additional datasets into reports, and create more granular and advanced reports in dashboards.
Metrics like reach and frequency
As mentioned above, some metrics require careful management.
For example, if our report includes ad frequency broken down by week, then neither the sum nor the average of these values will give you an accurate number as it would be reported on the Facebook Ads platform or reports.
I recommend downloading and adding the data for the period you want to report on and adding it as a separate table (or tab, if included in an existing report).
Calculated metrics
For values like average click-through rate, CPC, CPM or even ROI (return on investment) and ROAS, I recommend adding these values as metrics calculated in Data Studio.
Doing so is simple.
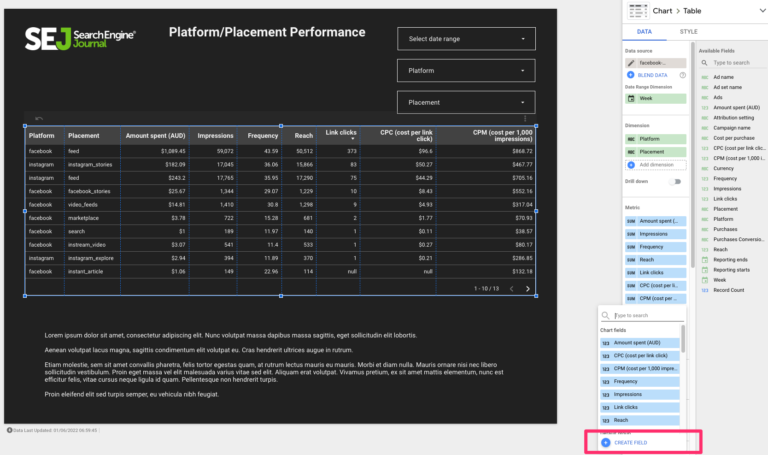
In Metrics, select Add metrics, Create fieldswhere you can build your values.
Note that this is not limited to these simple indicators, you can also create and add your own indicators.
 Screenshot of Google Insights, June 2022
For example, you can add values such as gross margin or other financial metrics, allowing you to better understand how your business is performing in relation to Facebook ads right from the dashboard!
Connectors and Automation
Creating integrated solutions that rely on manually downloading data or setting up workflows using tools like Zapier is easy and quick.
However, there are more advanced options.
These are especially useful for institutions and large enterprises that need to minimize manual tasks and support full automation for increased reliability (i.e. reduced margin of error) and speed, especially when dealing with large datasets.
To this end, our company adopts data killer (although there are others), a reporting tool that provides a powerful and easy-to-use Google Sheets connector.
The benefit is that you can use the connector to create and save queries in the worksheet, and once set up, the data can be pulled in automatically and refreshed periodically.
So, for example, we can set the query to download the first 7 days of data every Monday, so the Data Studio dashboard automatically refreshes and updates every week – No need to lift your finger.
Final Considerations
As we’ve seen, creating useful dashboards requires some planning and setup.
But the beauty of it is that dashboards (as collections of reports and charts) are inherently very powerful and flexible.
Don’t be afraid to start with a simple version and keep creating multiple iterations of it with different views, tables, charts, etc.
The time and effort invested will be worth it!
More resources:
Featured image: Griboedov/Shutterstock

