

Some pictures, for those who believe in the US constant or trend velocity quantity theory.
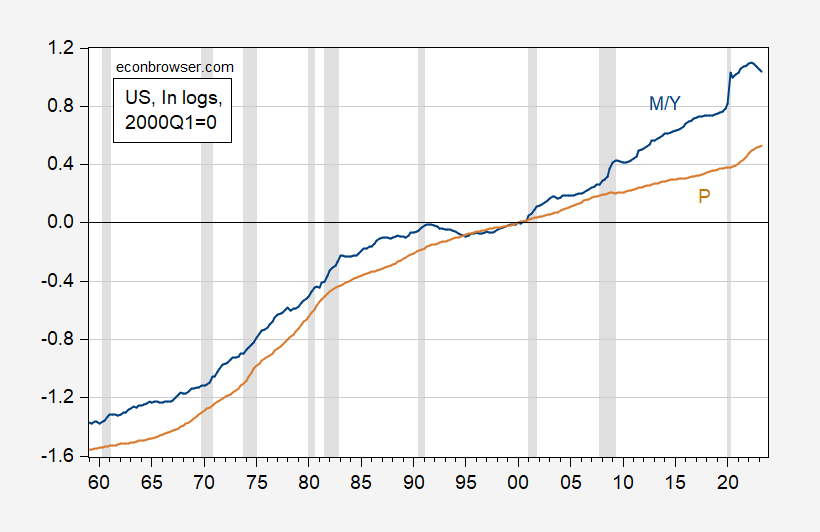
figure 1: Log M2 divided by real GDP (blue), log GDP deflator (tan), both Q1 2000 = 0. Recession peak-to-trough dates as defined by NBER are grayed out. Sources: BEA, Federal Reserve via FRED, NBER, and authors’ calculations.
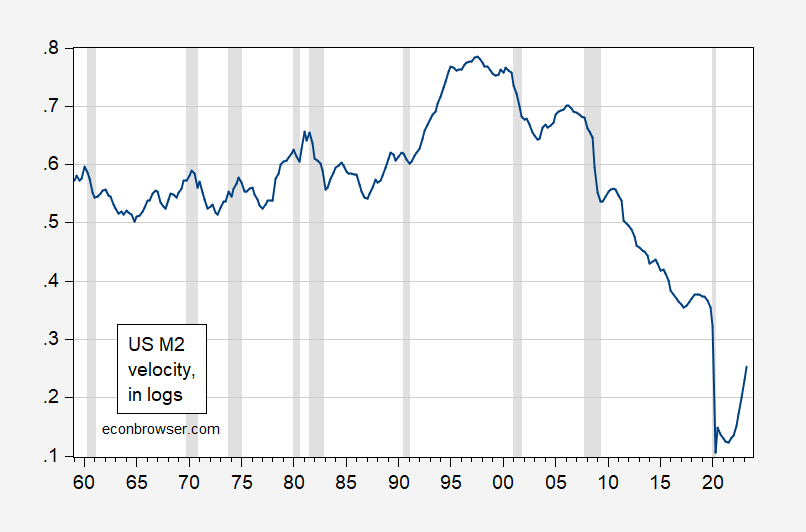
figure 2: Nominal GDP divided by M2 (blue), expressed logarithmically. Recession peak-to-trough dates as defined by NBER are grayed out. Sources: BEA, Federal Reserve via FRED, NBER, and authors’ calculations.
These charts highlight the fact that cross-country charts of money and price growth over the past 40 years, including high inflation countries such as Turkey, Brazil and Argentina, will ignore large deviations within countries, especially those with (relatively) small currency shocks nation.
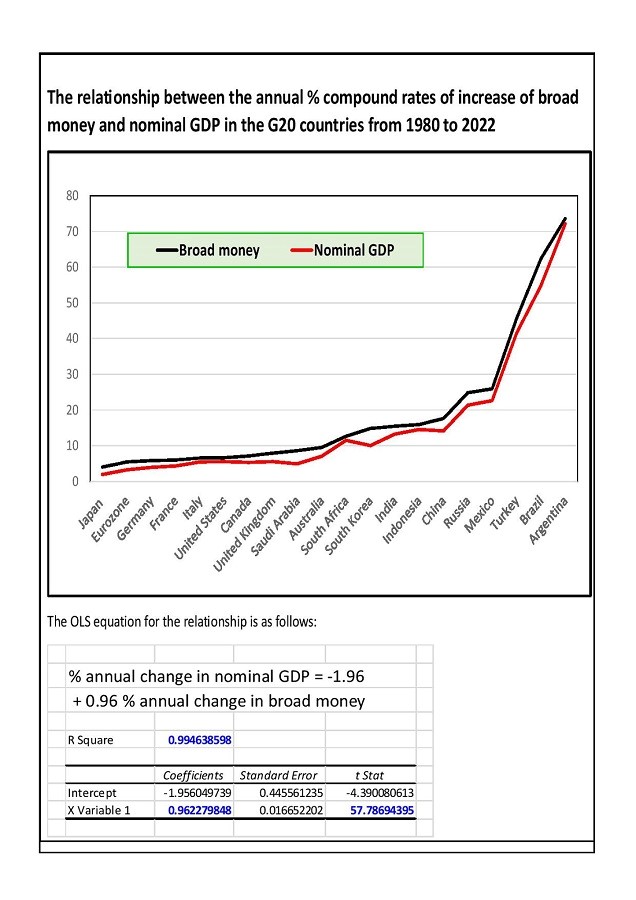
source: Tim Congdon, International Monetary Institute, 21 August 2023.

