

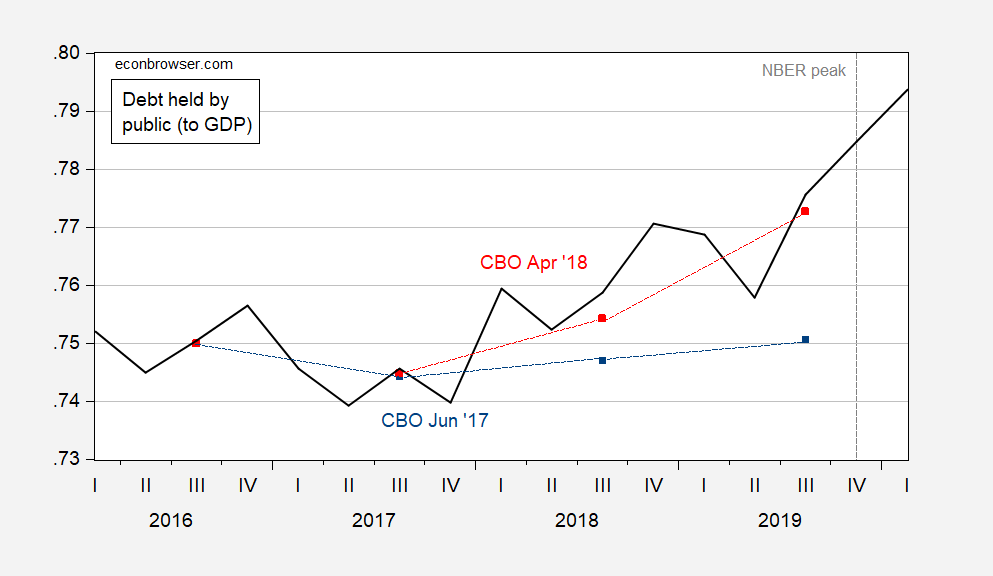
CBO debt forecasts before (CBO June 2017) and after (April 2018) December passage/signature, normalized by GDP and potential GDP.
figure 1: Public CBO forecast holdings of federal debt divided by nominal GDP as of June 2017 (blue squares) and as of April 2018 (red squares). Sources: CBO, Budget and Economic Outlook, June 2017, April 2018, BEA, and author's calculations.
This is debt normalized to CBO's estimate of potential GDP.
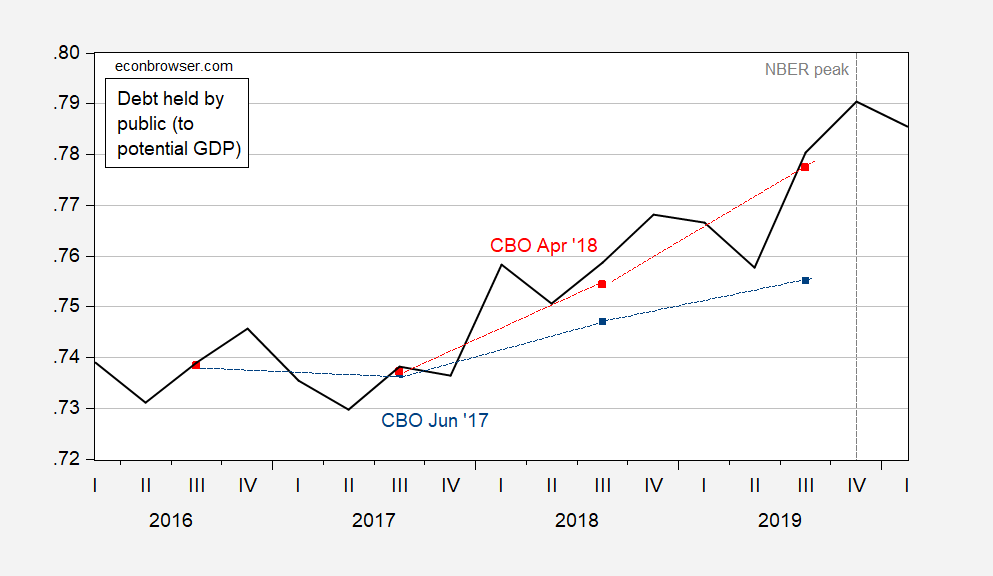
figure 2: The public CBO forecasts holdings of federal debt divided by nominal potential GDP as of June 2017 (blue squares) and as of April 2018 (red squares). Source: Congressional Budget Office, Budget and Economic Outlook, June 2017, April 2018, July 2023 (potential GDP) and author's calculations.
While we cannot attribute all changes in the debt-to-GDP ratio to TCJA, we do know that, using non-fantasy estimates, TCJA will blow a hole in government finances (see e.g. here). What were today's deficit hawks saying then (when the output gap was arguably quite small)? (Except CRFB, which opposed TCJA.)

