

Today (March 27, 2024), the Australian Bureau of Statistics (ABS) released the latest data – Monthly consumer price index indicator – In February 2024, the annual inflation rate was stable at 3.4%. Today's data is the closest to what's actually happening right now, showing that many of the factors that led to the sudden burst of inflation are now waning, and that the current big factors have more to do with abuse of market power than overspending. or excessive salary requirements. It’s worth noting that if we look at the All Groups Consumer Price Index excluding volatile items (items that move up and down regularly due to emergencies such as natural disasters, OPEC price hikes, etc.), the monthly inflation rate is zero and the annualized rate is zero. Inflation over the past six months was 2.5%, which is in the middle of the RBA's inflation target range. If we take the annualized rate of the series over the past three months, inflation is 2%, which is at the bottom of the RBA's range. The overall conclusion is that the global factors driving inflationary pressures are weakening rapidly as the world adjusts to the coronavirus pandemic, Ukraine and OPEC profiteering. This inflation has never been about overspending.
The latest ABS CPI monthly data for February 2024 shows:
- The CPI indicator for all groups remained stable at 3.4%.
- Food and non-alcoholic beverages rose 3.6% (compared to 4.4% in January).
- Clothing and footwear rose 0.8% (0.4% in January).
- Housing grew by 4.6% (compared to 4.6% in January). Rent (7.6% vs. 7.4%).
- Furniture and Household Equipment -0.3% (0.3% in January).
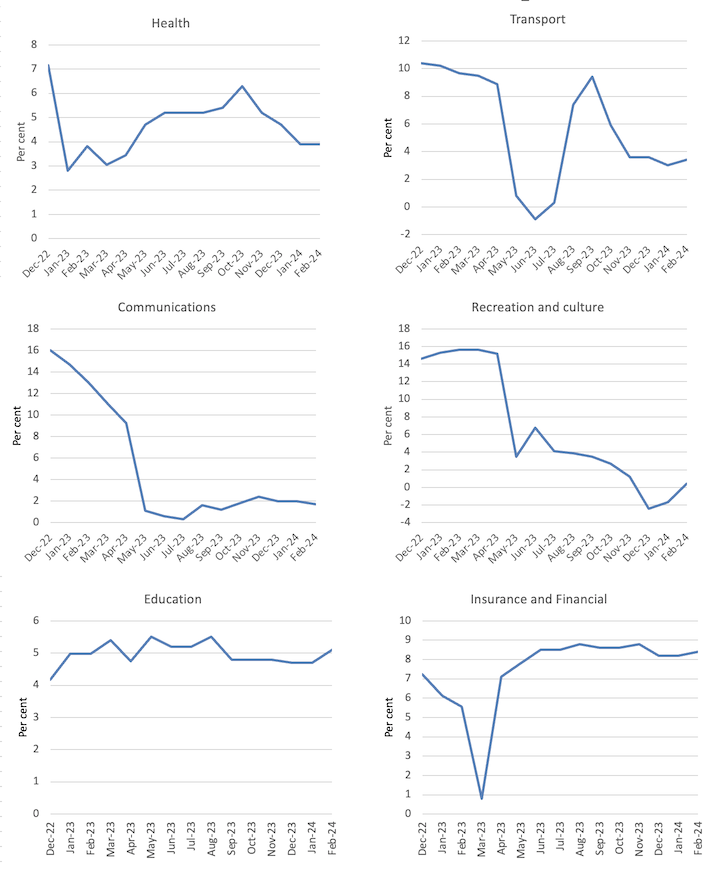
- The health index was 3.9% (3.9% in January).
- Transportation 3.4% (3% in January).
- Communications 1.7% (2% in January).
- Entertainment and Culture 0.4% (-1.7% in January).
- Education 5.1% (compared to 4.7% in January).
- Insurance and financial services grew 8.4% (8.2% in January).
ABS Media Release (February 28, 2024) – The monthly CPI measure rose 3.4% in the year to February 2024 – Point out:
Annual inflation remained unchanged in February at 3.4% for the third consecutive month…
The largest contributors to annual growth in February were housing (+4.6%), food and non-alcoholic beverages (+3.6%), alcohol and tobacco (+6.1%), and insurance and financial services (+8.4%). …
Rental prices rose 7.4% in the 12 months to January, reflecting a tight rental market and low vacancy rates nationwide…
While Swift's performance led to higher hotel prices in Sydney and Melbourne, accommodation and airfare prices elsewhere fell in February as the travel peak during the January school holidays ended.
So some observations:
1. Inflation has stabilized and will decline steadily in the coming months.
2. It is worth noting that if we consider the Consumer Price Index (CPI) for all groups excluding volatile items (items that fluctuate regularly up and down due to unexpected events such as natural disasters, OPEC price hikes, etc.), then the monthly inflation rate is zero , with an annualized rate of zero, inflation over the past six months was 2.5%, which is in the middle of the RBA's inflation target range.
3. If we take the annualized rate of the series over the past three months, inflation is at 2%, which is at the bottom of the RBA's range.
5. Rents are rising in part because of the Reserve Bank of Australia's own interest rate hikes, as landlords in a tight housing market are simply passing on higher borrowing costs – so so-called anti-inflation rate hikes are actually driving inflation .
6. Insurance inflation reflects the impact of several natural disasters (floods, fires, etc.) – which are short-lived events. This component is also driven by profit-seeking in the non-competitive banking industry.
7. The overall conclusion is that the global factors causing inflationary pressures are weakening rapidly as the world adjusts to the coronavirus pandemic, Ukraine and OPEC profiteering.
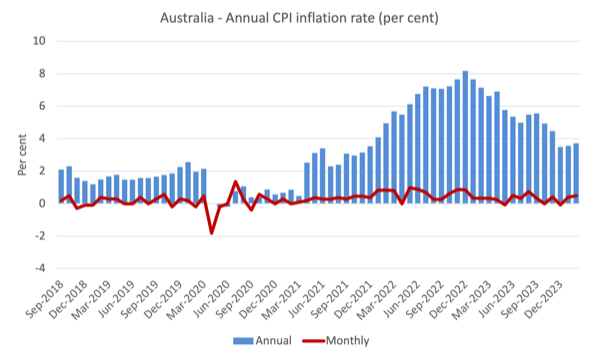
The next chart shows that the annual inflation rate is moving in one direction – declining on a month-to-month basis, reflecting special events or adjustments (e.g. seasonal natural disasters, annual index schedules, etc.).
The blue column shows the annual rate, and the red line shows the month-to-month change in CPI for all items.
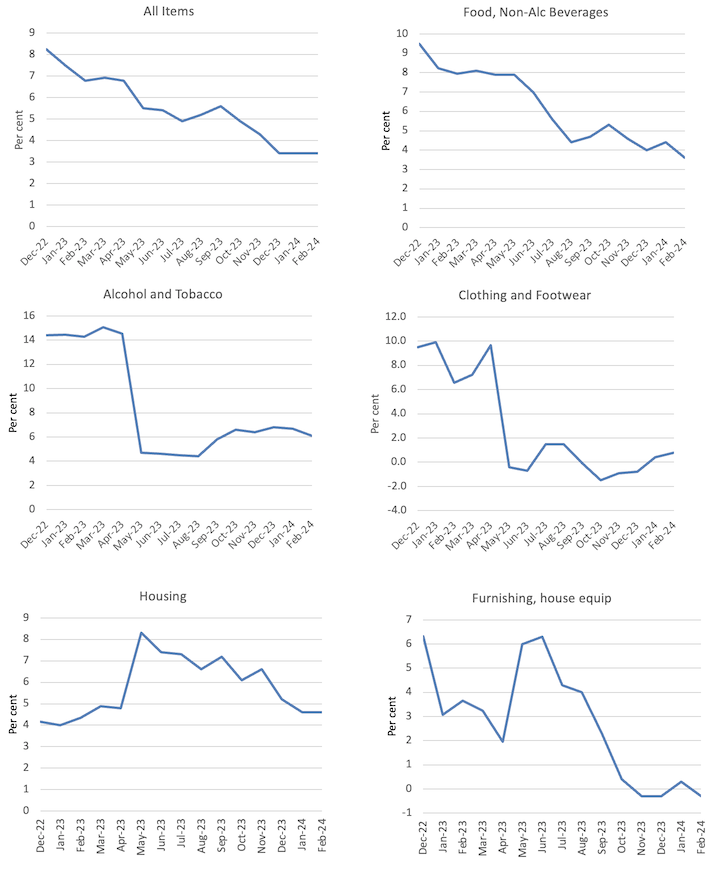
The chart below shows the changes in the main components of CPI for all projects from January 2022 to February 2024.
Overall, as noted above, price growth has fallen sharply across most components and the exceptions do not provide any justification for further rate hikes by the RBA.
For example, the entertainment and culture segment that drove inflation in 2023 is now deflating—reflecting only a temporary rebound in travel and related activities after widespread lockdowns and other restrictions early in the pandemic.
It always adjusts back to more normal behavior.
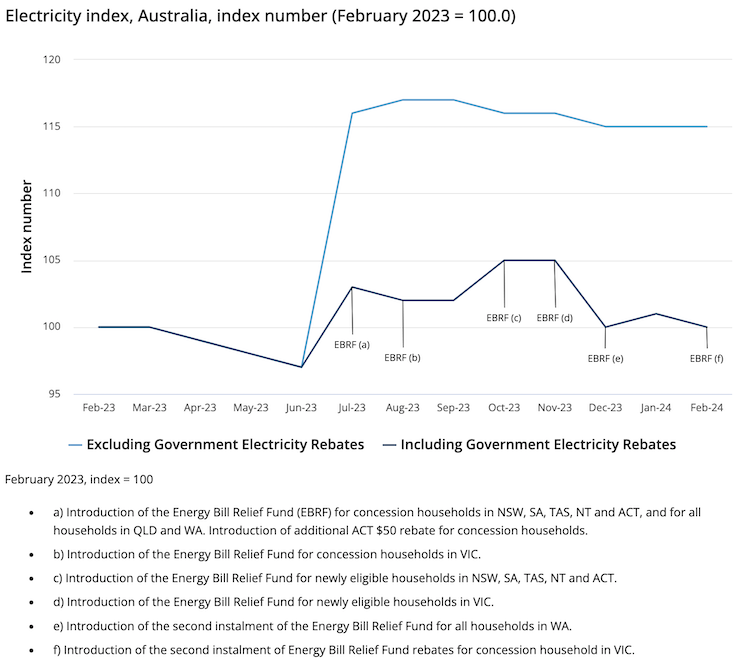
The ABS has also released an interesting chart comparing electricity prices under federal regulations: Energy Bill Relief Fund – Rebates introduced in July 2023 and in the absence of fiscal intervention.
The relief fund provides subsidies to households and small businesses based on region.
For example, a family in Victoria could receive a $250 rebate.
The ABS report said that without rebates, “power prices would have risen by 14.9% in the 12 months to February 2024”.
This is the impact of this simple and very modest plan.
It shows that targeted fiscal policy can indeed fight inflation, which means that the relationship between spending and inflation is never as simple as the dominant narrative would have you believe.
But the problem is that the overall impact of fiscal policy over the past few years has been negative.
GDP growth has slowed sharply over the past 12 months, with retail sales figures falling as fiscal policy shifted from deficit-generating to surplus-generating.
The mainstream view is that it is rising interest rates that caused the economic slowdown.
But during the global financial crisis, the Australian Treasury conducted research to estimate the relative contribution of monetary and fiscal policy to a modest recovery in GDP following the massive global financial shock we imported.
They estimate that fiscal stimulus contributed significantly to quarterly growth rates during the first four quarters of the global financial crisis (from the first quarter onwards).
On January 8, 2009, the Federal Ministry of Finance issued a report entitled – Fiscal policy returns – Attended the 2009 Australian Business Economists Annual Forecast Conference.
I wrote about this in this article – Today’s lesson: The public sector saved us (January 21, 2009).
Another interesting part of their work is estimating the impact on GDP growth of a rapid rate cut by the Reserve Bank.
This analysis provides a direct comparison between expansionary fiscal policy and easy monetary policy.
The conclusion is clear:
…As of the third quarter of 2009, the fall in real borrowing rates contributed less than 1% to GDP growth, while the estimated contribution of discretionary fiscal packages during the same period was about 2.4%.
Therefore, the effect of discretionary fiscal policy changes is estimated to be about 2.4 times greater than that of monetary policy changes (a record high).
Although interest rates have been raised 11 times since May 2022, the fiscal balance has shifted from a deficit of 6.4% of GDP in 2020-21 and a deficit of 1.4% of GDP in 2021-22. Surplus of 0.9% of GDP in 2022-23.
The federal government expects another surplus this financial year.
This is a significant fiscal shift, and fiscal drag is the main reason for the slowdown in growth and spending.
One commentator wrote today – Can Australia achieve once-impossible targets on jobs and inflation? — What confounds economists is that as interest rates rise, unemployment remains low.
This is not surprising once we consider two factors:
1. Recent episodes of inflation are not driven by excessive demand forces (excessive spending) as central bankers claim (except in Japan).
This is a unique event, where the factors driving price levels to accelerate are of supply-side origin and are largely unaffected by interest rate increases, making the overall central bank response ridiculous and unnecessary.
Inflation will always fall.
2. But raising interest rates creates a demand effect, which is related to the asymmetry of monetary policy – a characteristic that central bankers are reluctant to talk about.
This asymmetry is related to the consumption propensity of different income groups affected by interest rate changes.
Higher-income groups have a lower marginal propensity to consume (meaning they save more for each additional dollar of disposable income) than lower-income households.
They also have more financial wealth.
When interest rates rise, low-income households' total expenses don't change much because they already spend all their income.
Only the ingredients have changed.
They also have little financial wealth and therefore cannot capture any income growth through rising returns.
For high-income households, their income from financial assets increased significantly, and although they saved more than low-income households, their spending increased through the wealth effect.
These changes do not work in reverse.
Thus, in places with greater financial wealth (such as the United States) and less restrictive fiscal policy, we observe continued economic growth, lower unemployment, and falling inflation.
The reason the Philip Curve trade-off does not work (falling inflation is not accompanied by rising unemployment) is that inflation is a supply-side rather than a demand-side event.
Most central bankers and economists get it very wrong here.
Therefore, given that the wealth effect for financial asset holders in Australia is likely to be lower than in countries such as the United States, Australia's GDP slowdown is more likely to be the result of fiscal drag rather than rising interest rates. .
Music-When will you leave heaven
This is what I heard at work this morning.
One day, I was going through a cabinet that contained a lot of old records, and I found old records from the 1950s by an American guitarist and singer – Big Bill Bronze.
He was one of the finest guitarist-vocalists in the blues tradition and inspired many who followed him.
The song “When Will You Leave Heaven” was recorded in 1936 as part of the film Sing, baby, sing.
It has been reported several times since.
This version is from a live concert recorded in Antwerp, Belgium in 1956.
In addition to the beautiful singing and playing, the video is also a work of art.
He died of throat cancer within two years of this concert (note he ended up smoking!).
That's enough for today!
(c) Copyright 2024 William Mitchell. all rights reserved.

