

There is nearly a percentage point difference between the CBO forecast and the average SPF forecast for 2024.
figure 1: Ten-year Treasury yields (black), forecast by CBO (tan), SPF average (blue), and ten-year TIPS (red), all expressed in %. NBER Recession peak to trough dates appear gray. Source: Treasury, from FRED, CBO, Federal Reserve Bank of Philadelphia, NBER.
The CBO's forecasts are based on current law, while individual forecasters in the SPF are not similarly bound. I don't think that explains the difference.
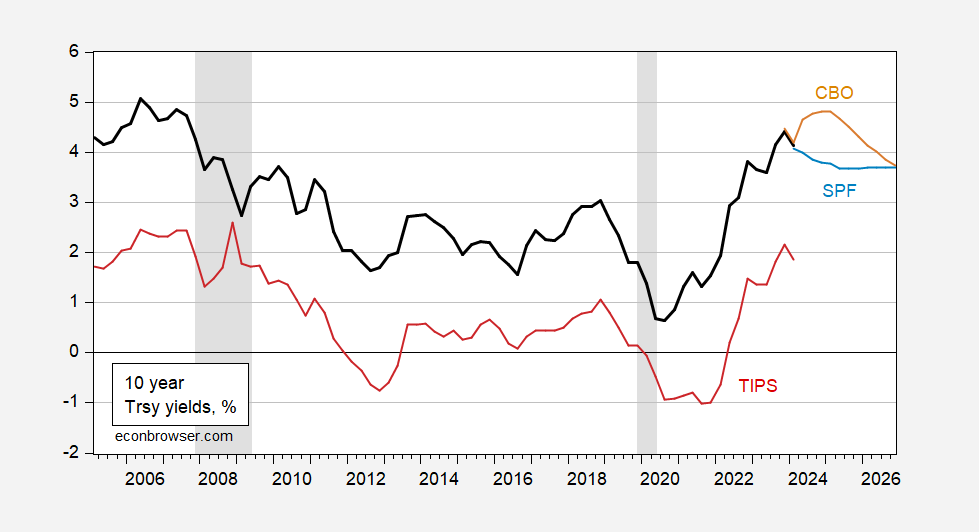
Therefore, the impact on interest payments (and therefore the overall deficit versus the primary deficit) is different.
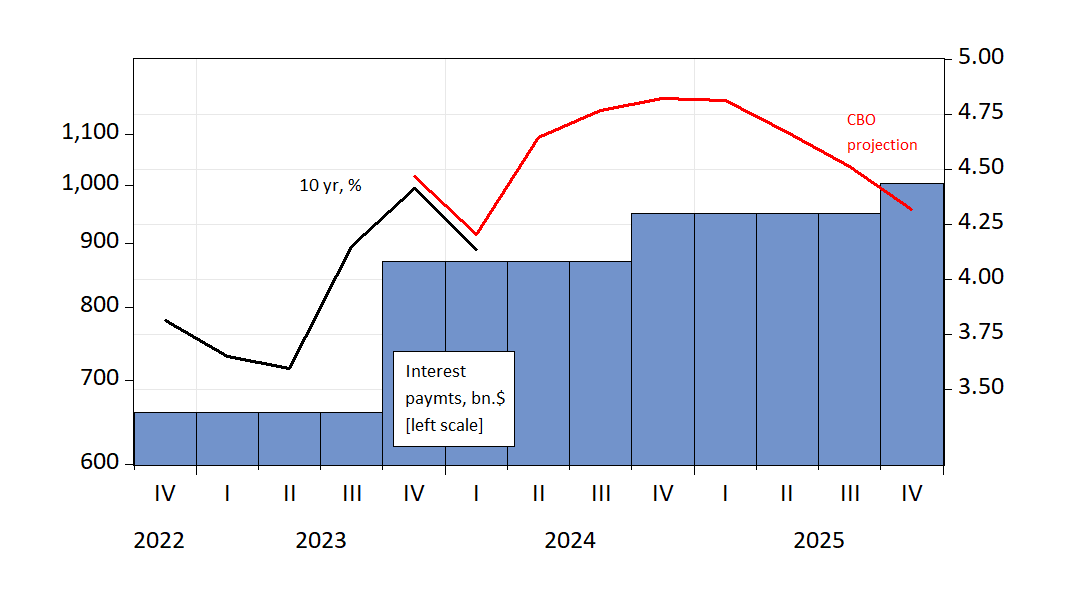
figure 2: Federal interest payments ($ billion), SAAR (blue bar, left log scale), 10-year Treasury note (black), and CBO forecast (red), all expressed as percentages (right scale). 2024Q1 is from January to February. Source: CBO, Treasury Department via FRED.

