

Food processing salaries:
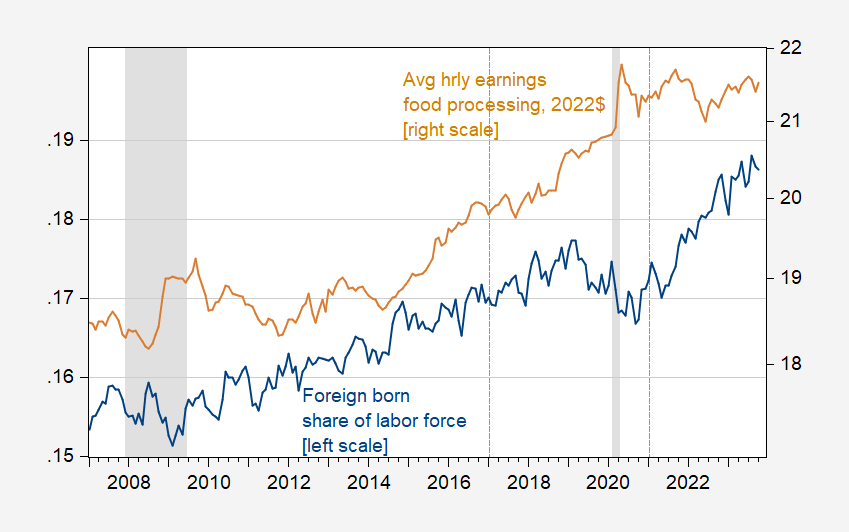
figure 1: The foreign-born labor force (nsa) as a share of the civilian labor force over 16 (sa) (blue, left scale), and real wage $ in nondurable goods manufacturing (food) in 2022 (tan, right log scale). Seasonally adjusted chained CPI using X13. NBER-defined recession peak-to-trough dates are in gray. The Trump administration’s red dotted line. Source: BLS, NBER, and author's calculations.
I chose food processing salaries (food processing) because it is one of the industries with the highest share of foreign-born labor (nondurable goods) and also has one of the highest job openings in 2021.
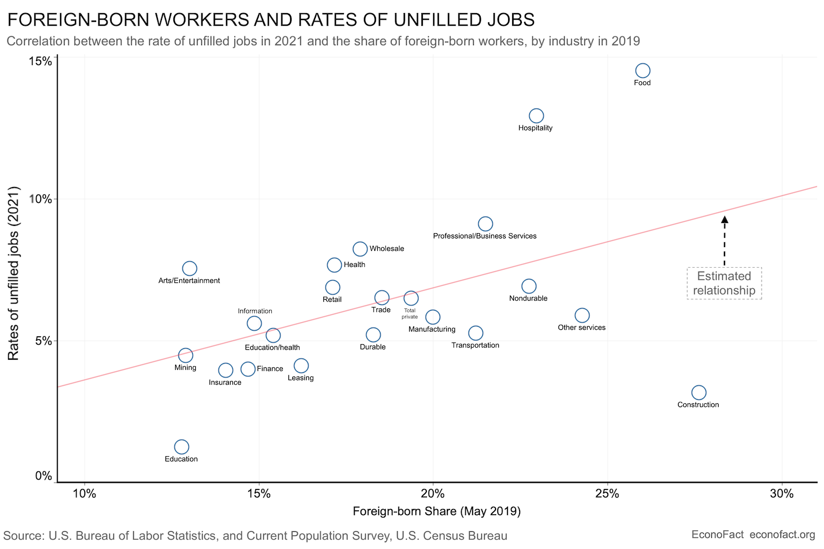
source: Peri, Zalour, EconoFact (2022).
As the foreign-born trend reestablished itself in the labor force, relative wages returned to trend.
For comparison, here are real wages over time for nondurable goods and food services.
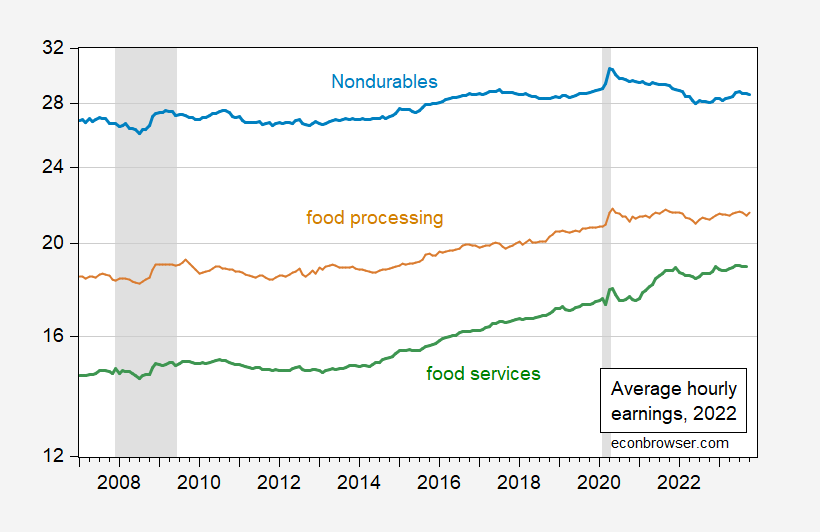
figure 2: Real wage $ in 2022 Nondurable Goods Manufacturing – Food (tan), Nondurable Goods Manufacturing (light blue), Hospitality and Leisure – Food Services (green). Seasonally adjusted chained CPI using X13. NBER-defined recession peak-to-trough dates are in gray. The Trump administration’s red dotted line. Source: BLS, NBER, and author's calculations.
Surges in wages relative to trend appear to coincide with wage shortages.

