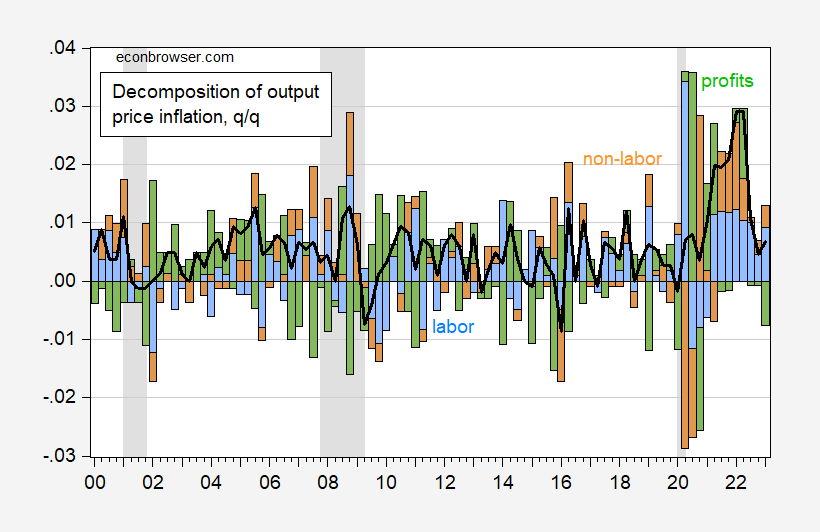
For the nonfinancial corporate business sector, the price per unit of real gross value added is used.
figure 1: Month-on-month price inflation for gross value added (black line), unit labor cost (blue bar), non-labor unit cost (brown) and profit (green). Dates of peak-to-trough recessions as defined by the NBER are shaded in gray. Source: BEA 2023Q1 2nd Edition, Table 1.15, NBER and authors’ calculations.
Note that in an accounting sense, profits substantially increased the price level of gross value added in some quarters (e.g. Q3 2020, Q1-Q2 2021) and in others (e.g. Q4) deducted
The real GVA price of the non-financial corporate business sector is not the commonly quoted deflator. Comparisons with the CPI and PCE deflators are useful.
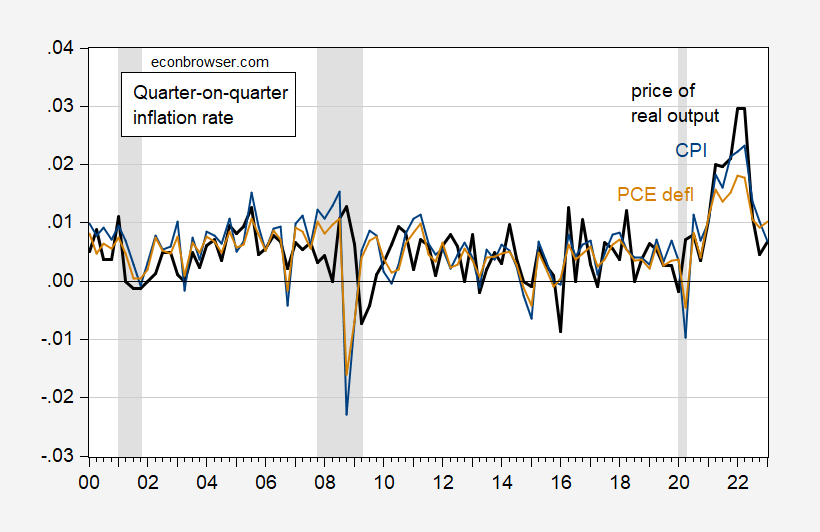
figure 2: MoM inflation for gross value added prices (black line), CPI (blue) and PCE deflator (tan). Dates of peak-to-trough recessions as defined by the NBER are shaded in gray. Source: BEA 2023Q1 2nd Edition, Table 1.15, BLS and BEA, via FRED, NBER and author’s calculations.
What has been the cumulative impact since the pandemic began? As shown in Figure 3.
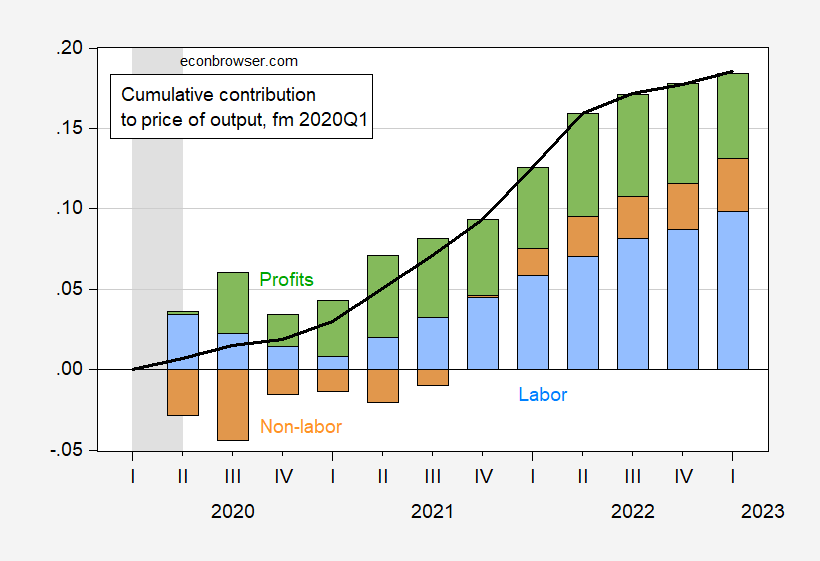
image 3: The cumulative contributions of GVA price (black line), unit labor cost (blue bar), non-labor unit cost (brown) and profit (green) are all relative to the first quarter of 2020. Dates of peak-to-trough recessions as defined by the NBER are shaded in gray. Source: BEA 2023Q1 2nd Edition, Table 1.15, NBER and authors’ calculations.
Note that labor costs are specifically unit labor costs; therefore, they incorporate changes in productivity.
The picture shows that while corporate profits are not insignificant to rising prices, they are actually (proportionally) smaller than labor costs.