

Is core CPI inflation in a new state? Results using the Markov switching model (Started by James Hamilton).
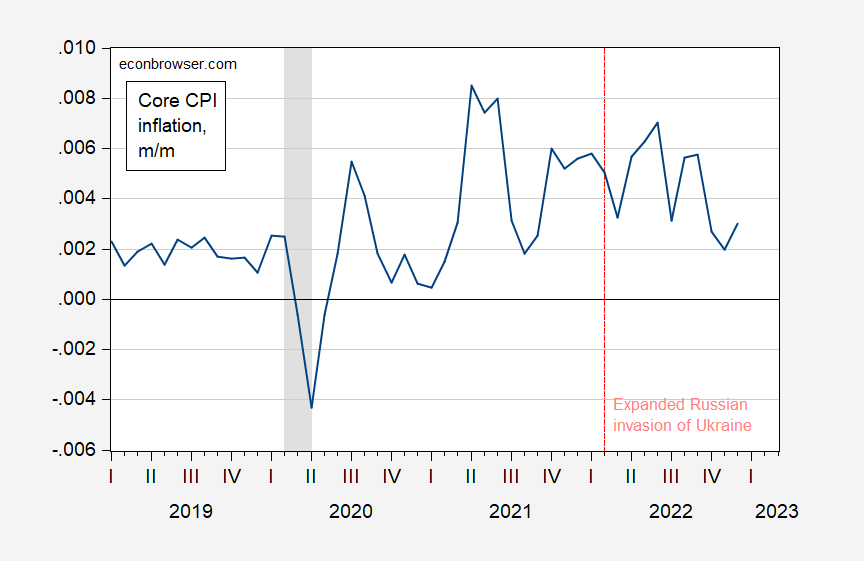
figure 1: Core CPI monthly inflation m/m log difference (blue). Dates of peak-to-trough recessions as defined by NBER are shaded in gray. Sources: BLS, NBER, and authors’ calculations.
Applying a simple Markov-transition 2-state estimation method (implemented in EViews with default settings, allowing for different variances) over the period 1960-2022 yields the following estimates.
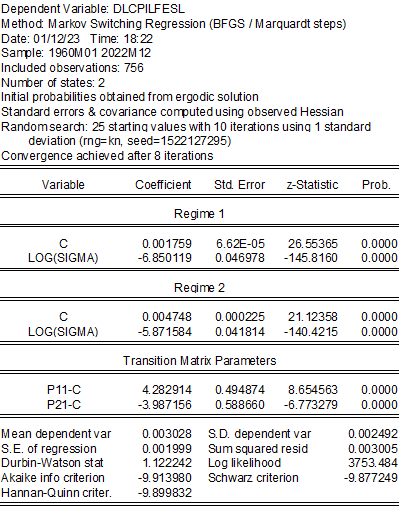
This estimate yields the following regime estimates (filtered, smoothed):
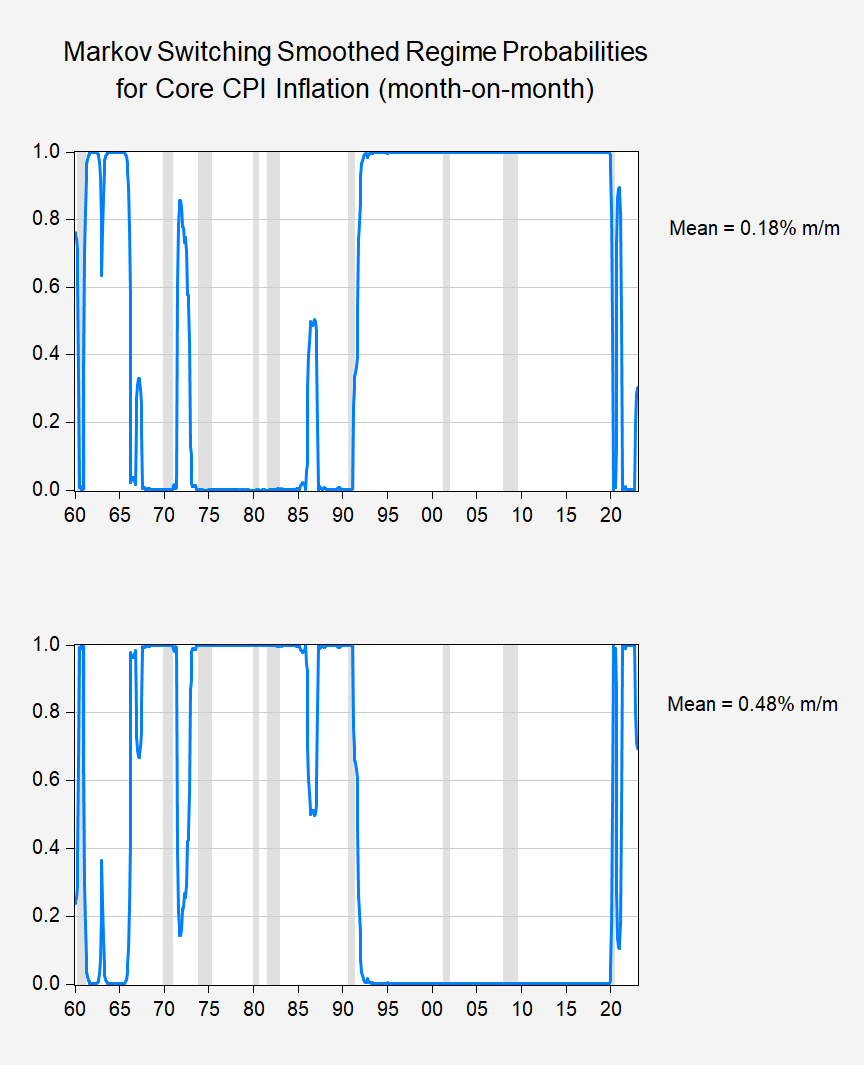
Estimates point to a 30% chance of low inflation. The results are somewhat sensitive to assumptions about the differences between the two regimes. Imposing constraints on the common variance results in the following estimated probabilities of being in both regimes.
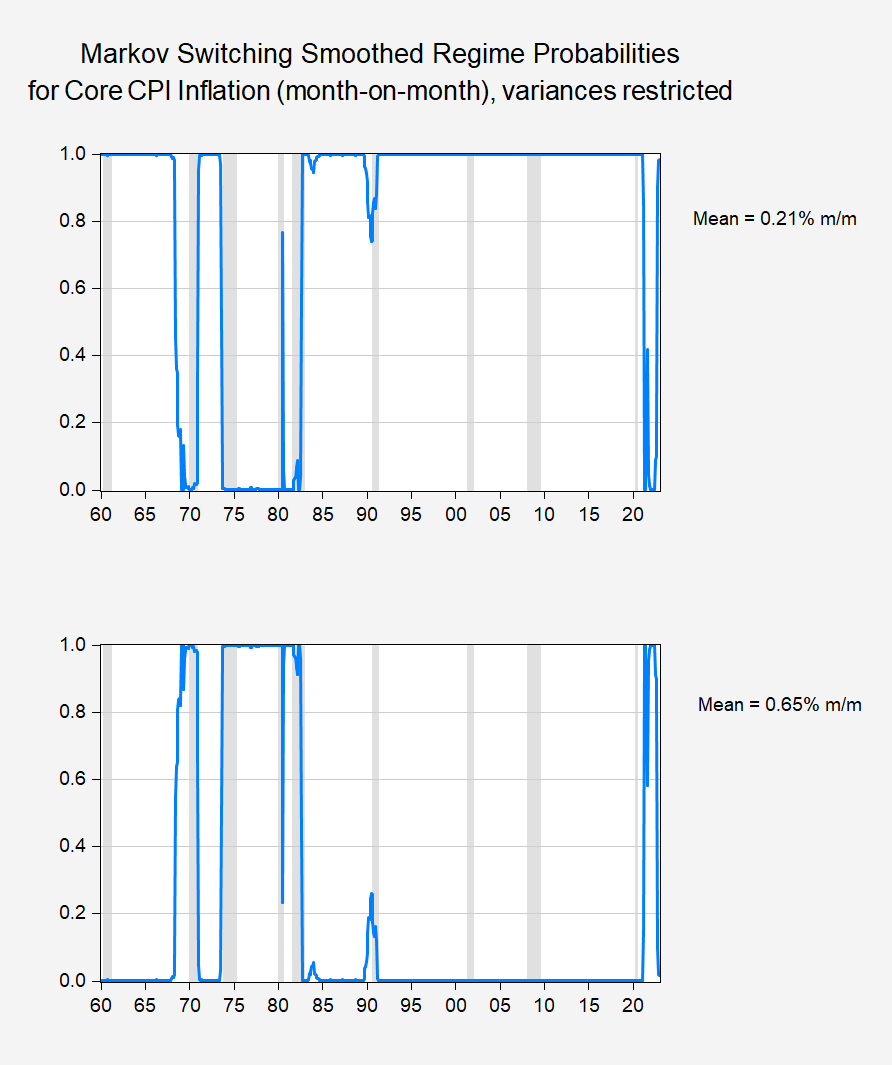
Imposing constraints on common variance, the signs of a shift to a low-inflationary regime are much stronger.

