

Over the past nine months, the S&P 500 appears to have peaked and is now falling. Risk, discount, or something else?
figure 1: S&P 500 (blue, log scale on the left) and VIX (red, scale on the right). 5/18 Observed Noon, ET. Source: Fred.
How far to go? Who knows, but an asset pricing framework can help think through important factors. The stock price should be the current discounted value of expected future dividend streams. Of course, most things of interest are unobservable – what is the market’s expectation of dividends, what is the discount rate (composed of the risk-free rate and the equity risk premium), whether there is a bubble. Assuming no bubbles – then make another assumption about dividends and earnings, with the P/E ratio as an interesting variable.
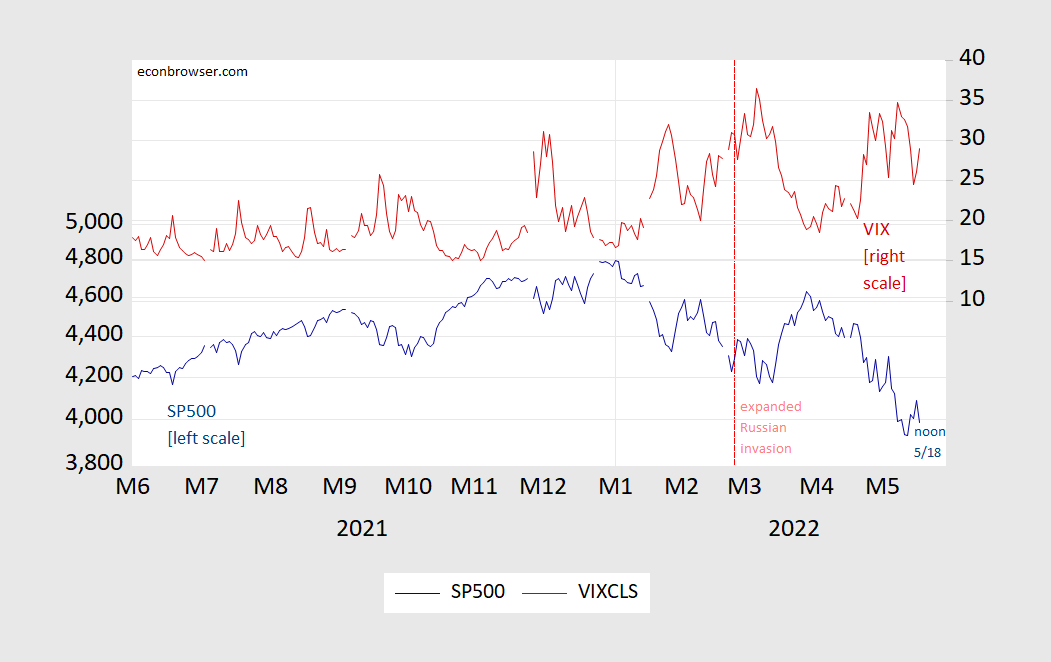
Here’s Shiller’s Cyclically Adjusted P/E, compared to the Real 10-Year Yield (TIPS):
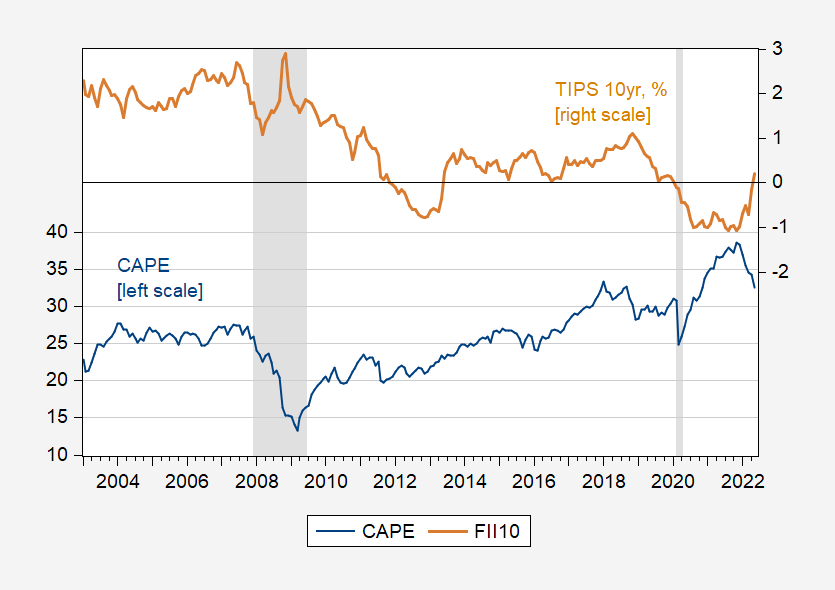
figure 2: Shiller Cyclically Adjusted Price-to-Earnings Ratio (CAPE) (blue, left scale), TIPS 10-year, % (brown, right scale). Recession dates as defined by NBER are shaded from peak to trough in gray. source: SchillerTreasury through FRED, NBER.
As long as the trajectory of expected real interest rates continues to move upward, CAPE is likely to continue to decline, even if risk appetite and the expected return path remain unchanged. (Note that the CAPE is still high, but well below the value of 43.8 recorded in January 2000.)

