

A series of investment banking newsletters (FuGuo bank, GS) prompted me to look at what happened to the overall trade balance after Trump raised tariffs:
source: FuGuo bank.
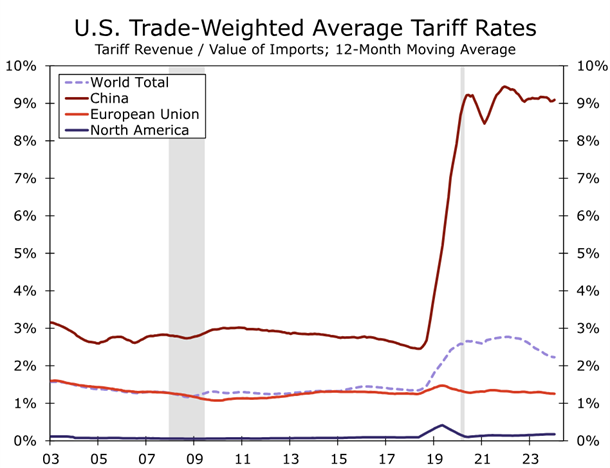
U.S. trade-weighted tariffs on world imports have roughly doubled to nearly 3%. What happened to total net exports and the current account (expressed as a share of GDP)?
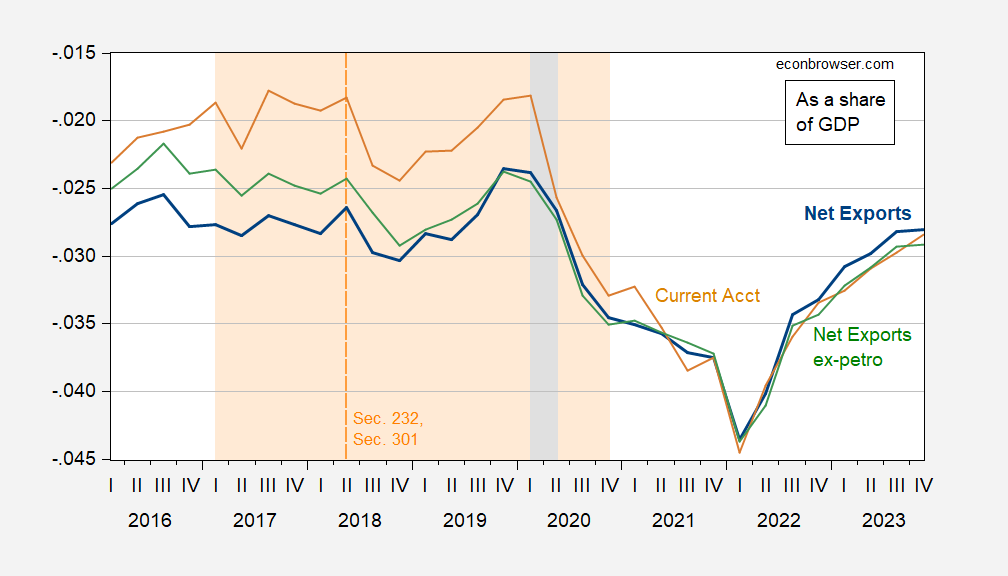
figure 1: Net exports as a share of GDP (bold blue), net exports excluding oil (green) and the current account (tan), all as a share of GDP. The Trump administration's start of Section 232 and Section 301 actions is indicated by the dotted orange line. NBER-defined recession dates are shaded gray. Source: BEA, NBER, and author's calculations.
At the beginning of Trump's administration, net exports accounted for -2.8% of GDP; by the end of the year (the fourth quarter of 2020), the figure was -3.5%. What if oil imports and exports are not included? Then it worsened even more – from -2.4% to -3.5%.
What if we started in the second quarter of 2018 when the trade war really started? By the end of the administration, the net export ratio fell from -2.6% to -3.5%.
What about imports – rather than trade balance? Here, changes in imports are difficult to see.
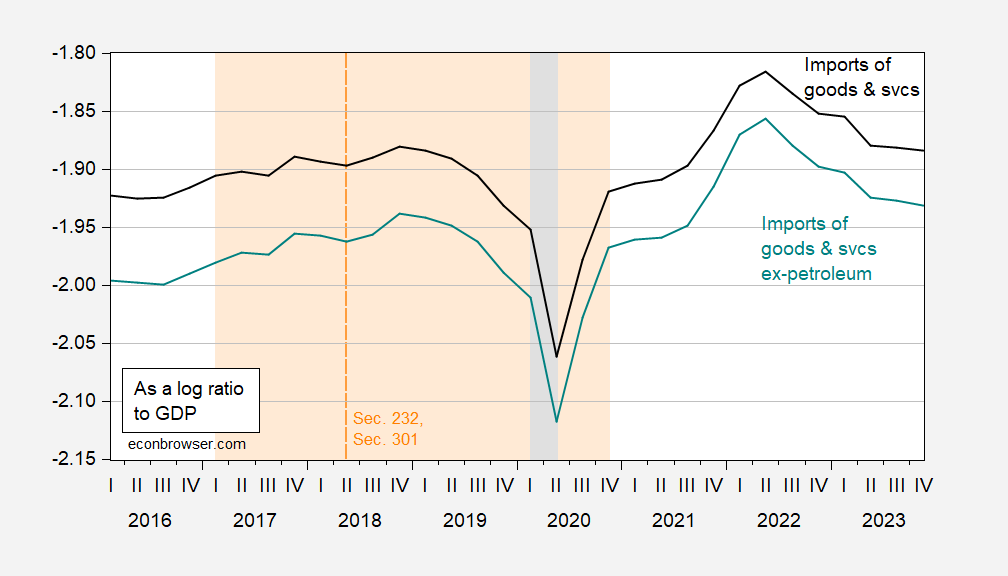
figure 2: GDP imports (black) and oil imports (cyan) are expressed in logarithmic terms in 2017 US dollars. The Trump administration's start of Section 232 and Section 301 actions is indicated by the dotted orange line. NBER-defined recession dates are shaded gray. Source: BEA, NBER, and author's calculations.
Imports did decline starting in 2019, but I attribute that more to a stronger dollar than tariffs. In any case, by the end of the Trump administration, imports other than oil were about the same share of real GDP as they were at the start of the tariff war.
Since Mr. Trump believes that services should not be included in trade balance calculations, I include the evolution of the trade balance in goods (only).
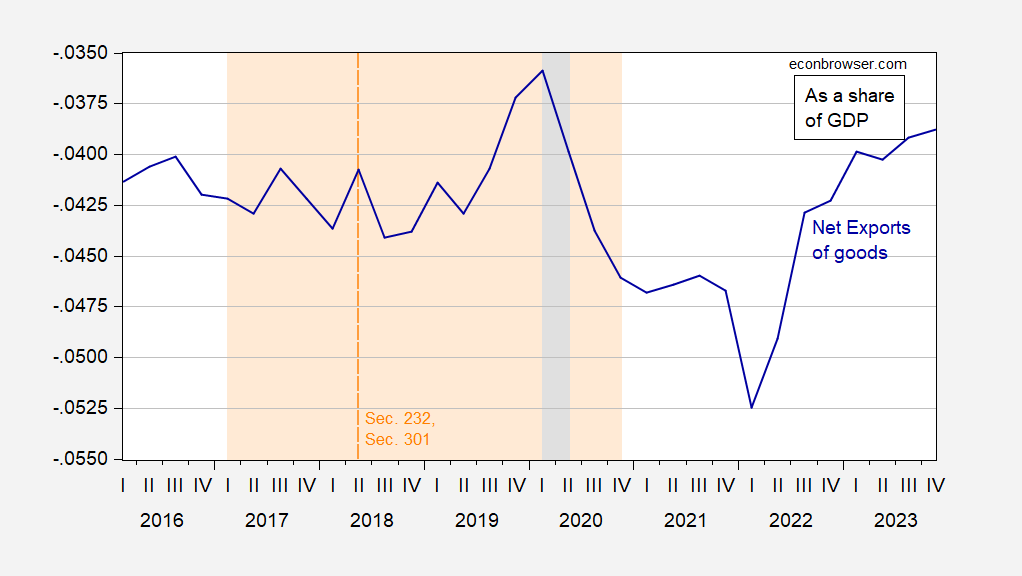
image 3: Net exports of goods as a share of GDP (dark blue), as a share of GDP. The Trump administration's start of Section 232 and Section 301 actions is indicated by the dotted orange line. Recession dates as defined by the NBER are gray. Source: BEA, NBER, and author's calculations.
This also dropped.
So what about Mr. Trump’s statement:
“The United States has suffered from huge trade deficits for years. That's why we have $20 trillion in debt. so We're going to change that. ” June 30, 2017
This is the ratio of NIIP to GDP.
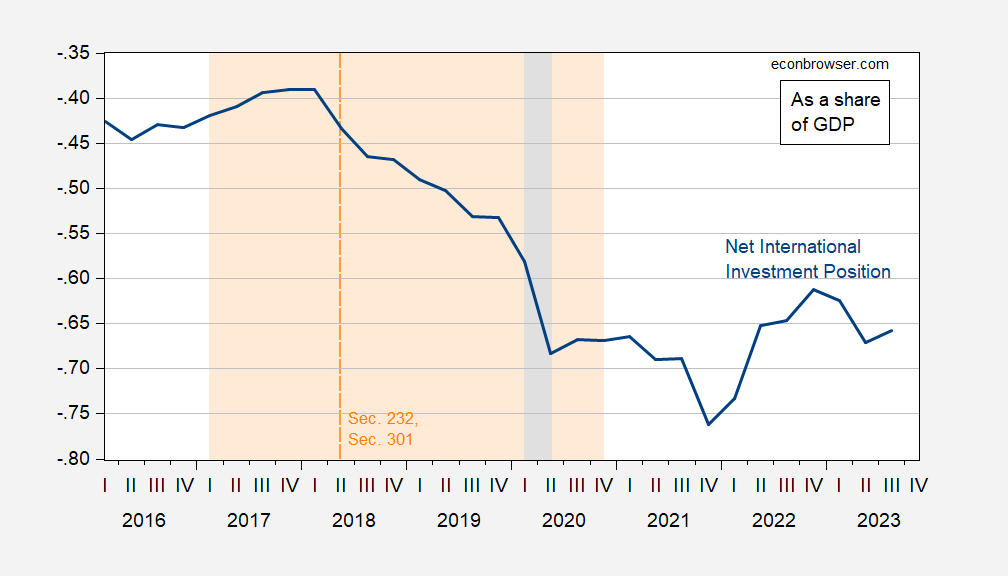
Figure 4: The proportion of international net investment positions (excluding derivatives) to GDP. The Trump administration's start of Section 232 and Section 301 actions is indicated by the dotted orange line. NBER-defined recession dates are shaded gray. Source: BEA, NBER, and author's calculations.
Well, not quite “mission accomplished” yet. When the tariff war began, NIIP accounted for -43% of GDP; by the end of the Trump administration, NIIP was -67%. While the change in NIIP was largely affected by exchange rate changes, the cumulative current account (an alternative measure of NIIP that is not affected by such large exchange rate-related valuation changes) did also rise from -50.3% to -53.0%. same period.

