

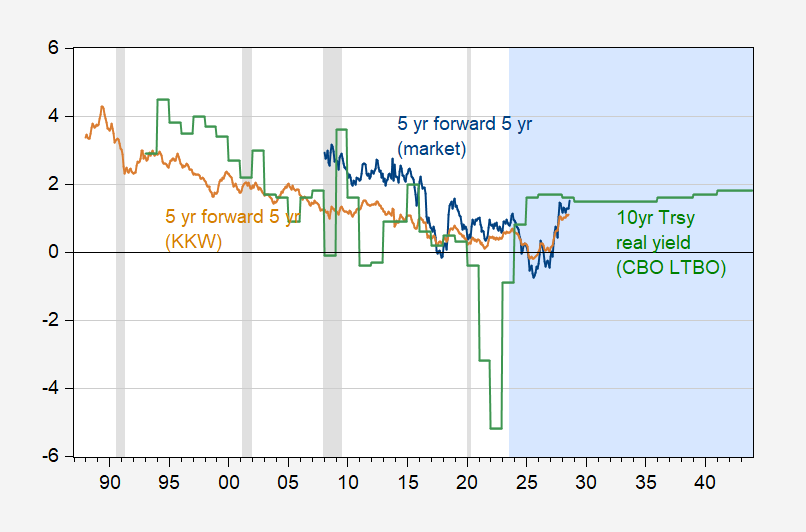
long-term real interest rate forecasts, and r*.
From the market, from the CBO. Both are predicting that real interest rates will rise (although market indicators seem to have gotten off track over the past few years).
figure 1: 10-year real Treasury yield (green) from the CBO Long-Term Budget Outlook and 5-year 5-year real rate from the market (blue), adjusted for KKW (tan). Light blue shading indicates projection periods. Recession peak-to-trough dates as defined by NBER are in light gray. Sources: CBO, Treasury via FRED, KKW, NBER, and author’s calculations.
What about r* (the rate at which an output is set to a potential output)?Here are two estimates of r* from Baker et al.at the New York Fed.
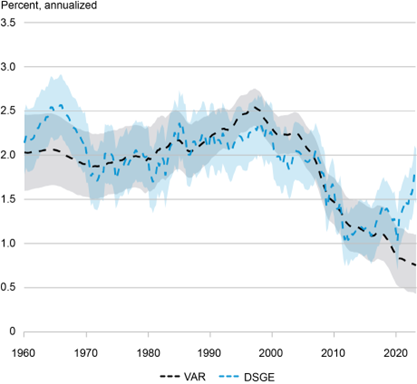
figure 2:r* Estimated from VAR and DSGE as described in Baker et al. (2023).
Obviously, as discussed in the article, there are some disagreements. The DSGE approach suggests a return to pre-2000 levels, while the VAR suggests that the decline is likely to continue.

