

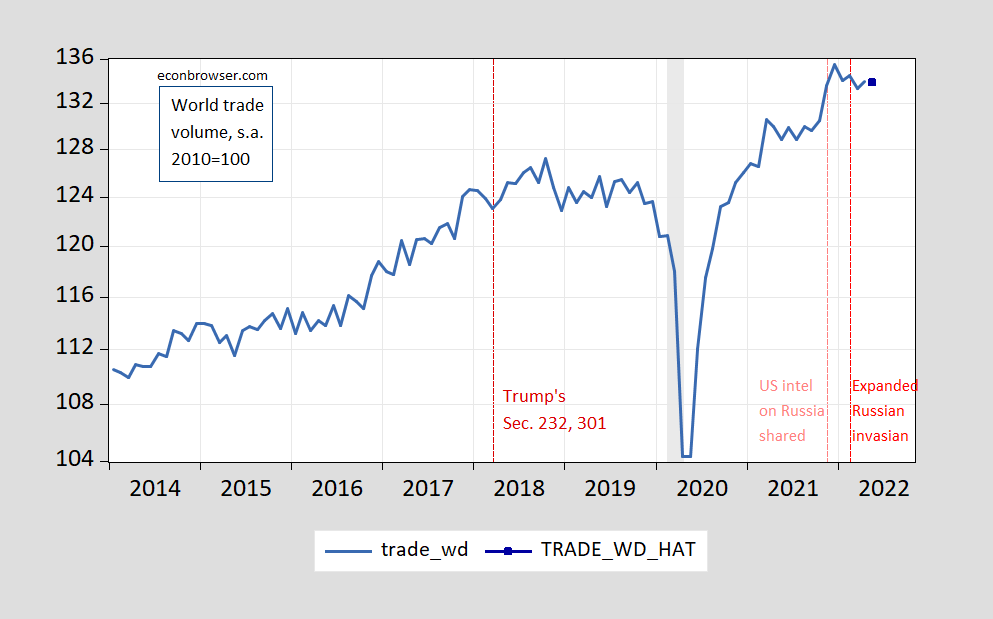
from Netherlands Bureau for Economic Policy Analysis (CPB), world trade volumes as of April 2022:
Figure 1: World trade volume in 2010 = 100 (blue), forecast using ECM (blue squares). The NBER defines the peaks and troughs of U.S. recessions as shades of gray. Source: Dutch CPB, NBER and author’s calculations.
On a seasonally adjusted basis, world trade volumes have been declining since December 2021. My forecast, based on the lagged (logarithmic) levels of the World Trade and Container Throughput Index, and the first-order difference of the logarithmic container throughput, yields a slight decline in May (figures for May will be released by the CPB on Monday).
Interestingly, trade was on the rise before fears of Russian aggression intensified in November. Trade volumes have declined since the invasion. Also of interest is that trade volumes have declined well before the 2020 recession, and in fact one can pinpoint a local maximum as a few months after the first round of Section 301 tariffs took effect (thanks Trump! ).

