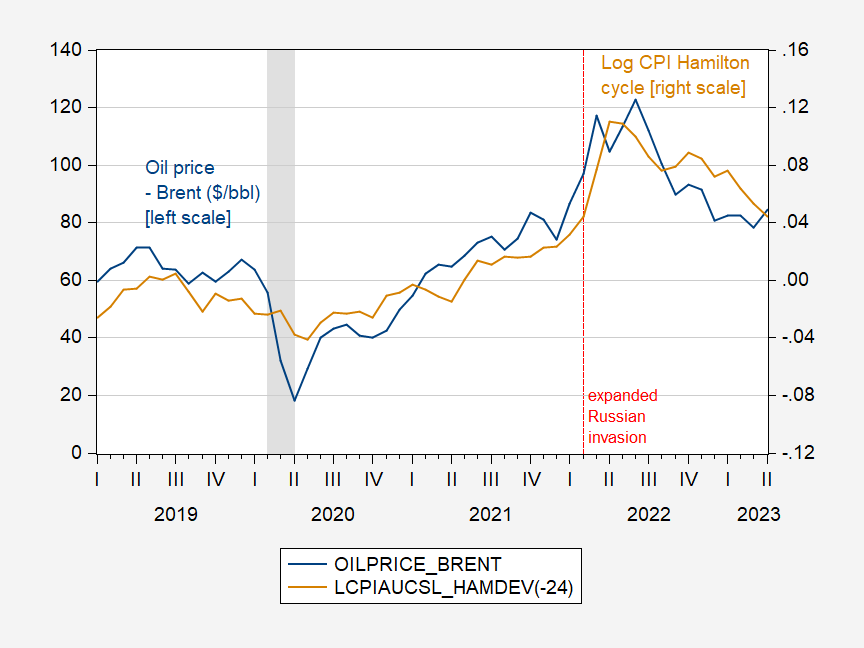
Reader Erik Poole suggested using the Hamilton filter rather than the Hodrick-Prescott filter to assess the extent to which the CPI deviates from trend (recall that I noticed that the CPI rose 2% relative to trend as oil prices rose before and after Russia expanded its invasion of Ukraine). I am (very) happy to oblige.
figure 1: Oil price (Brent), $/bbl (blue, left scale) and CPI trend deviation (Hamilton filter) (tan, right scale). Dates of peak-to-trough recessions as defined by NBER are shaded in gray. Sources: EIA, BLS via FRED, NBER, and author’s calculations.
I implemented Hamiltonian filter h=24, p=12. From November 2011 to June 2022, the HP cyclical component is up 2.1%, while the Hamilton filter shows a gain of 7.7%.This matches my guess Overall, the estimated cyclical component is larger for most typical US macro series.
Clearly, correlation is not causation; in particular, a common factor associated with higher oil prices and higher aggregate demand would in itself (with a fixed or depressed aggregate supply) drive up prices. However, I think all will agree that at least a significant portion of the energy component of the CPI is related to cost-push inflationary pressures.